
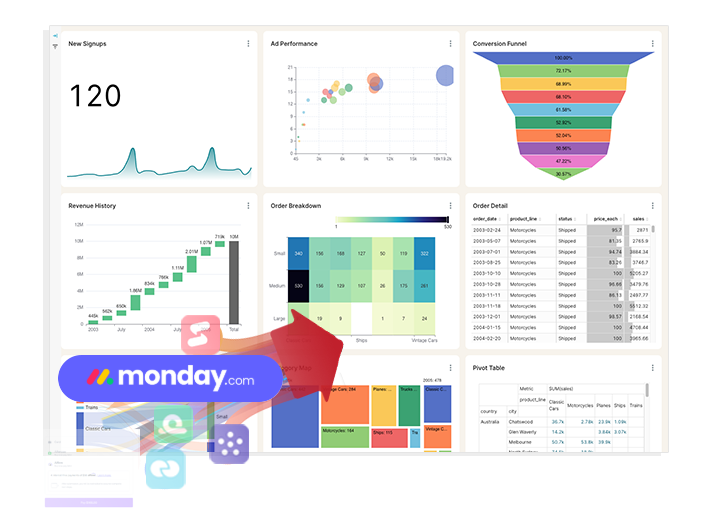
Turn your monday.com raw data into live reporting dashboards that fuel business insights.
BlinkMetrics extends what monday.com starts. While your boards keep projects moving, we deliver the advanced reporting that isn’t available on monday.com — historical trends, flexible segmentation, and client-ready dashboards that highlight progress and uncover opportunities without the manual work.

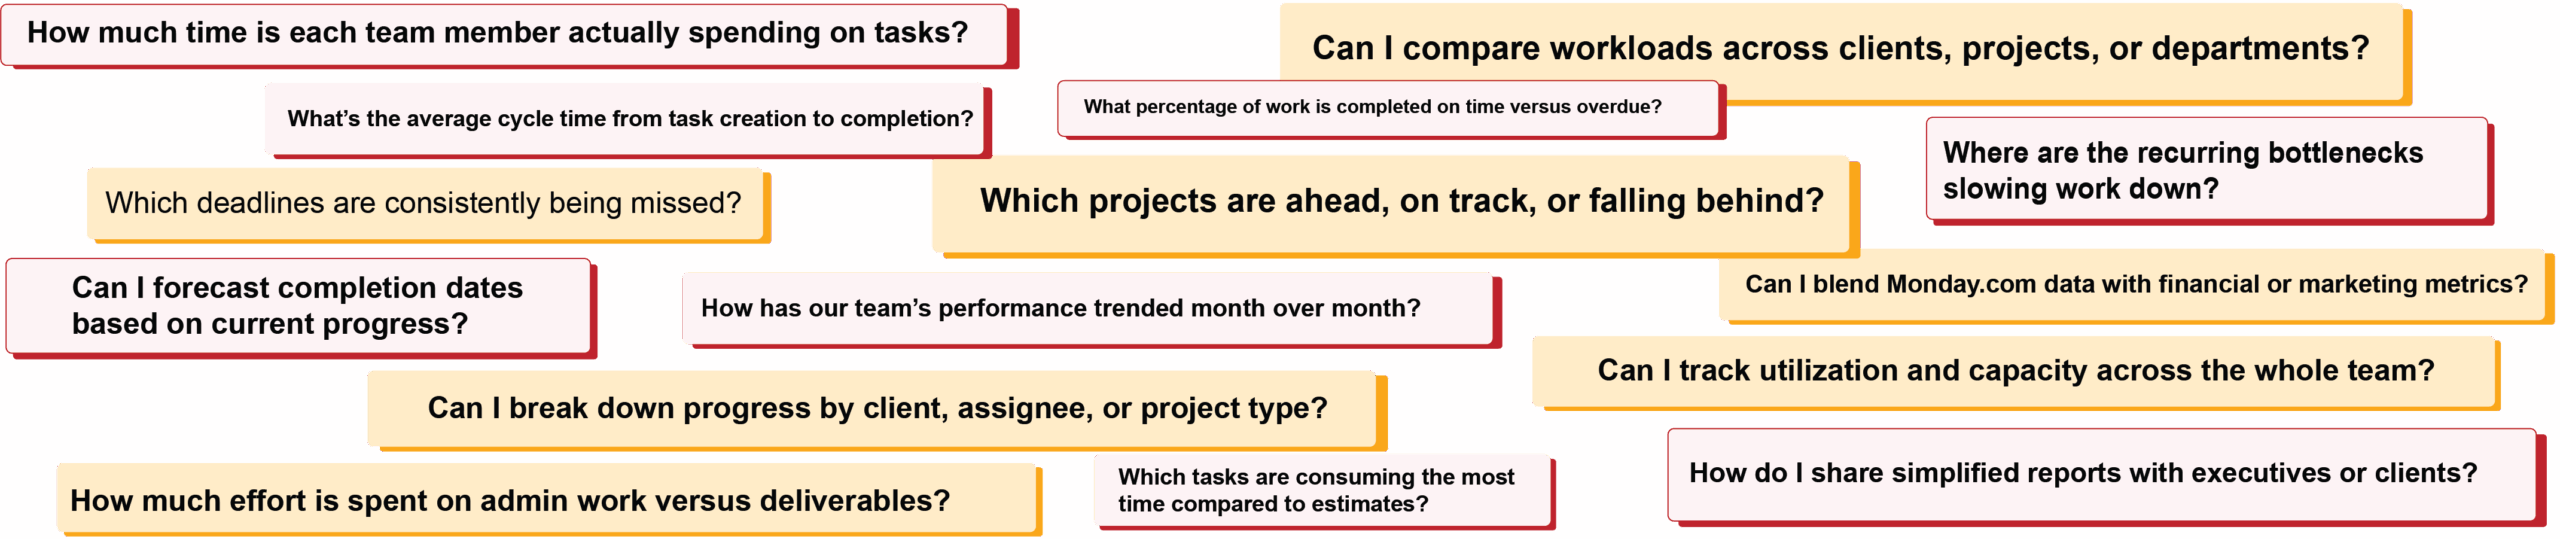
Sound Familiar? If these questions keep you up at night,
it's not you it's your reporting.
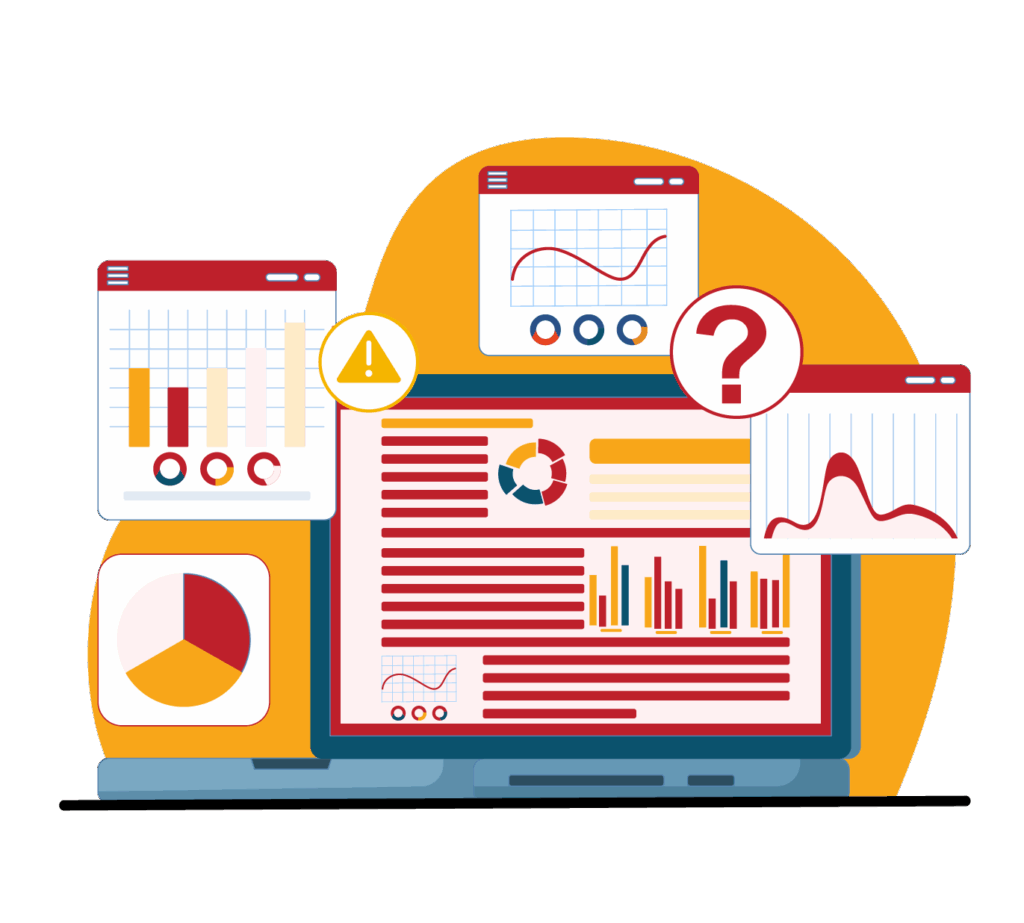
When Reporting Falls Short, Progress Gets Blurry.
monday.com is good for organizing tasks, but it stops short of showing the big picture. Without a historical view, flexible segments, or share reports, teams struggle to prove impact and make confident decisions.
Limited Historical Reporting
monday.com shows only the current state of work, with no way to track past performance. Teams can’t see trends or compare progress over time.
Rigid Dashboards & Filters
Dashboards require constant manual setup and lack flexibility. Slicing data by client, project, or employee quickly becomes tedious.

Custom Field & Data Gaps
Reports struggle with custom fields, subitems, and formulas. The result is incomplete views and messy data that’s hard to trust.

Sharing & Permissions Limits
Only one dashboard owner, limited visibility controls, and no role-based filtering. Sharing tailored reports with stakeholders is difficult.
monday.com Tracks Work. BlinkMetrics Delivers Insights.
You chose monday.com to streamline projects, not to wrestle with reporting. We replace the blind spots with clarity — giving you historical context, flexible segmentation, and easy-to-share dashboards that reveal the impact behind the tasks.
BlinkMetrics turns the datapoints from your various monday.com boards into a strategic business advantage. From uncovering workload bottlenecks to tracking client deliverables over time, you’ll have the insights needed to guide smarter, faster decisions.
No Coding | Fast Setup | Dedicated Support
Unlock monday.com's Full History
Automatically capture daily snapshots of projects and tasks. Answer questions like “How did our workload trend last quarter?” and track performance over time — not just today’s view.
Segment Insights Any Way You Need
See results by team, client, project, or department. Instead of cloning dashboards, explore your data flexibly and uncover the patterns monday.com alone can’t show.
Share Dashboards Without the Noise
Deliver curated, simplified dashboards to executives or clients without giving them access to everything. Everyone gets the view that matters to them.
Reporting That Runs Itself
Ditch manual exports and dashboard upkeep. BlinkMetrics builds and maintains your reporting, sending live insights automatically so you can focus on growth, not data chores.
Outgrowing monday.com’s Dashboards? BlinkMetrics Makes Them Better.
You started with monday.com to organize work — and it does that well. But as your business scales, you need deeper visibility. BlinkMetrics isn’t here to replace monday.com; it’s the advanced analytics layer that turns raw task data into real business intelligence.
Feature
monday.com Native Analytics
BlinkMetrics for monday.com
Historical Reporting
- Now View Only. Dashboards show today’s data but lack snapshots for week-over-week or month-over-month trends.
- Full History. Daily snapshots capture every change, letting you track performance patterns and compare results over time.
Data Segmentation
- Rigid. Limited ability to filter by client, team, or project without cloning multiple boards and dashboards.
- Flexible. Instantly segment by client, employee, project, or department — explore data without endless duplication.
Reporting Depth
- Surface-Level. Good for high-level overviews but lacks advanced breakdowns or contextual analysis.
- Deep & Custom. Unlock advanced analytics with custom fields, formulas, and insights built around your workflows.
Setup & Maintenance
- Do It Yourself. Requires manual exports, dashboard upkeep, and troubleshooting via forums.
- White-Glove Setup. Our experts build and maintain reporting for you, so insights arrive without the busywork.
Feature
monday.com Native Analytics
Historical Reporting
- Now View Only. Dashboards show today’s data but lack snapshots for week-over-week or month-over-month trends.
Data Segmentation
- Rigid. Limited ability to filter by client, team, or project without cloning multiple boards and dashboards.
Reporting Depth
- Surface Level. Good for high-level overviews but lacks advanced breakdowns or contextual analysis.
Setup & Maintenance
- Do It Yourself. Requires manual exports, dashboard upkeep, and troubleshooting via forums.
Feature
BlinkMetrics for monday.com
Historical Reporting
- Full History. Daily snapshots capture every change, letting you track performance patterns and compare results over time.
Data Segmentation
- Flexible. Instantly segment by client, employee, project, or department explore data without endless duplication.
Reporting Depth
- Deep & Custom. Unlock advanced analytics with custom fields, formulas, and insights built around your workflows.
Setup & Maintenance
- White-Glove Setup. Our experts build and maintain reporting for you, so insights arrive without the busywork.
Want to See the Bigger Picture?
Blend monday.com with the Rest of Your Business Data
BlinkMetrics closes monday.com’s reporting gaps and goes further — connecting data from the other tools your teams rely on to deliver a complete, all-in-one view of performance across your business.
- Connect Department Metrics: View monday.com projects alongside sales results, ad performance, or financial KPIs in the same dashboard.
- Track Time & Resources Accurately: Pull in data from platforms like Harvest or Toggle to measure true project costs and team capacity.
- Unify Your Insights: Eliminate silos by combining project data with marketing, finance, or operations for a complete picture of business impact.
We start by enhancing monday.com reporting, and then expand your view with data from every corner of the business.
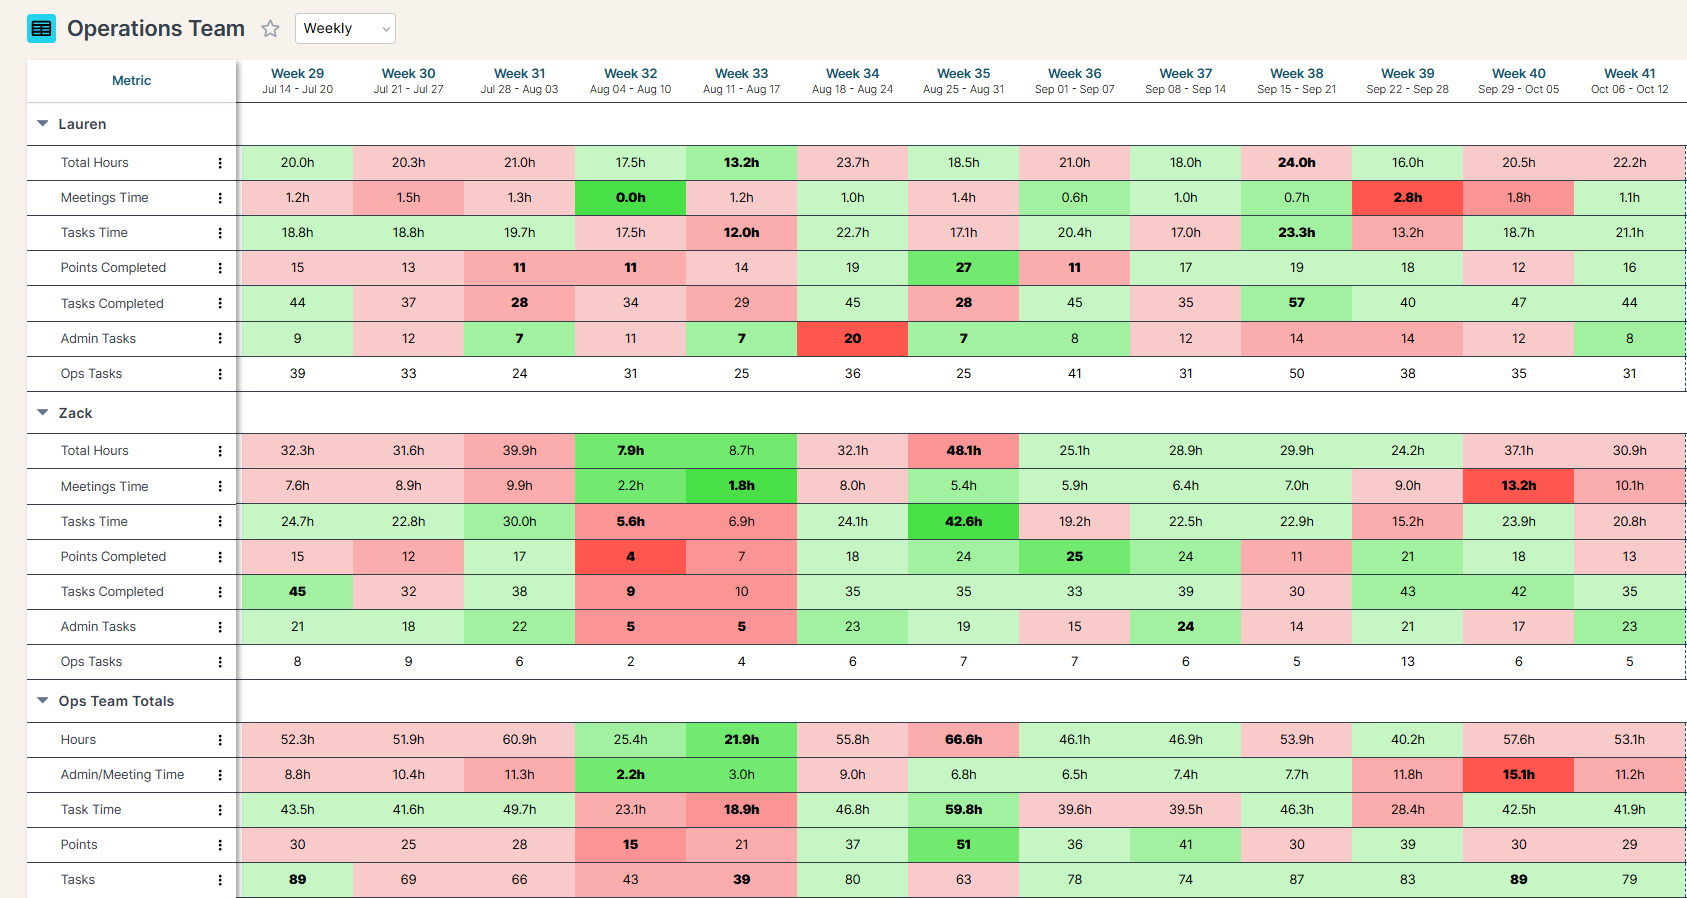
See BlinkMetrics in action
Move beyond monday.com’s dashboard limitations. Our integration reveals the historical trends, workload patterns, and segmentation views your team needs to finally see the full story behind the data.
Seamless Integration with monday.com
Connect BlinkMetrics to your monday.com boards in minutes. No complex setup, no coding, and no IT headaches—just instant, actionable visibility into the metrics that drive real performance and growth.
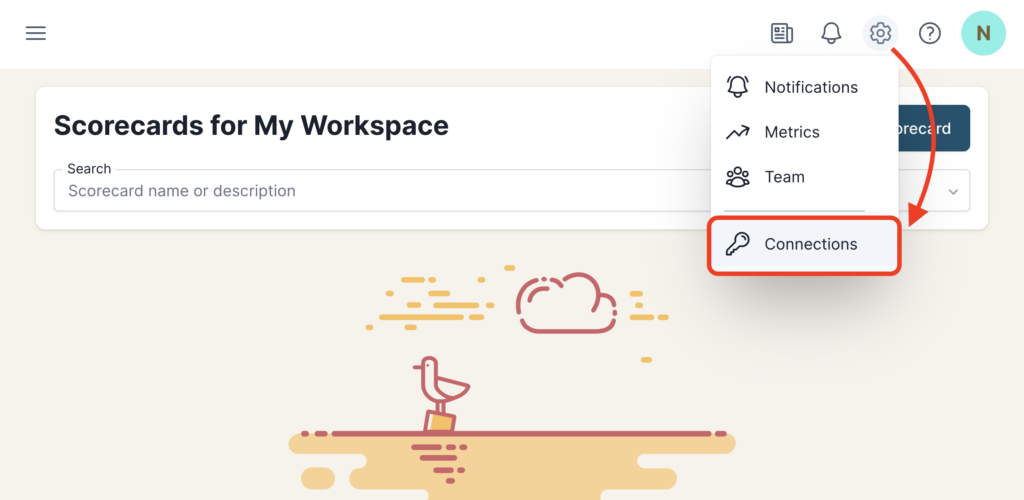
1. Go to the Connections Page
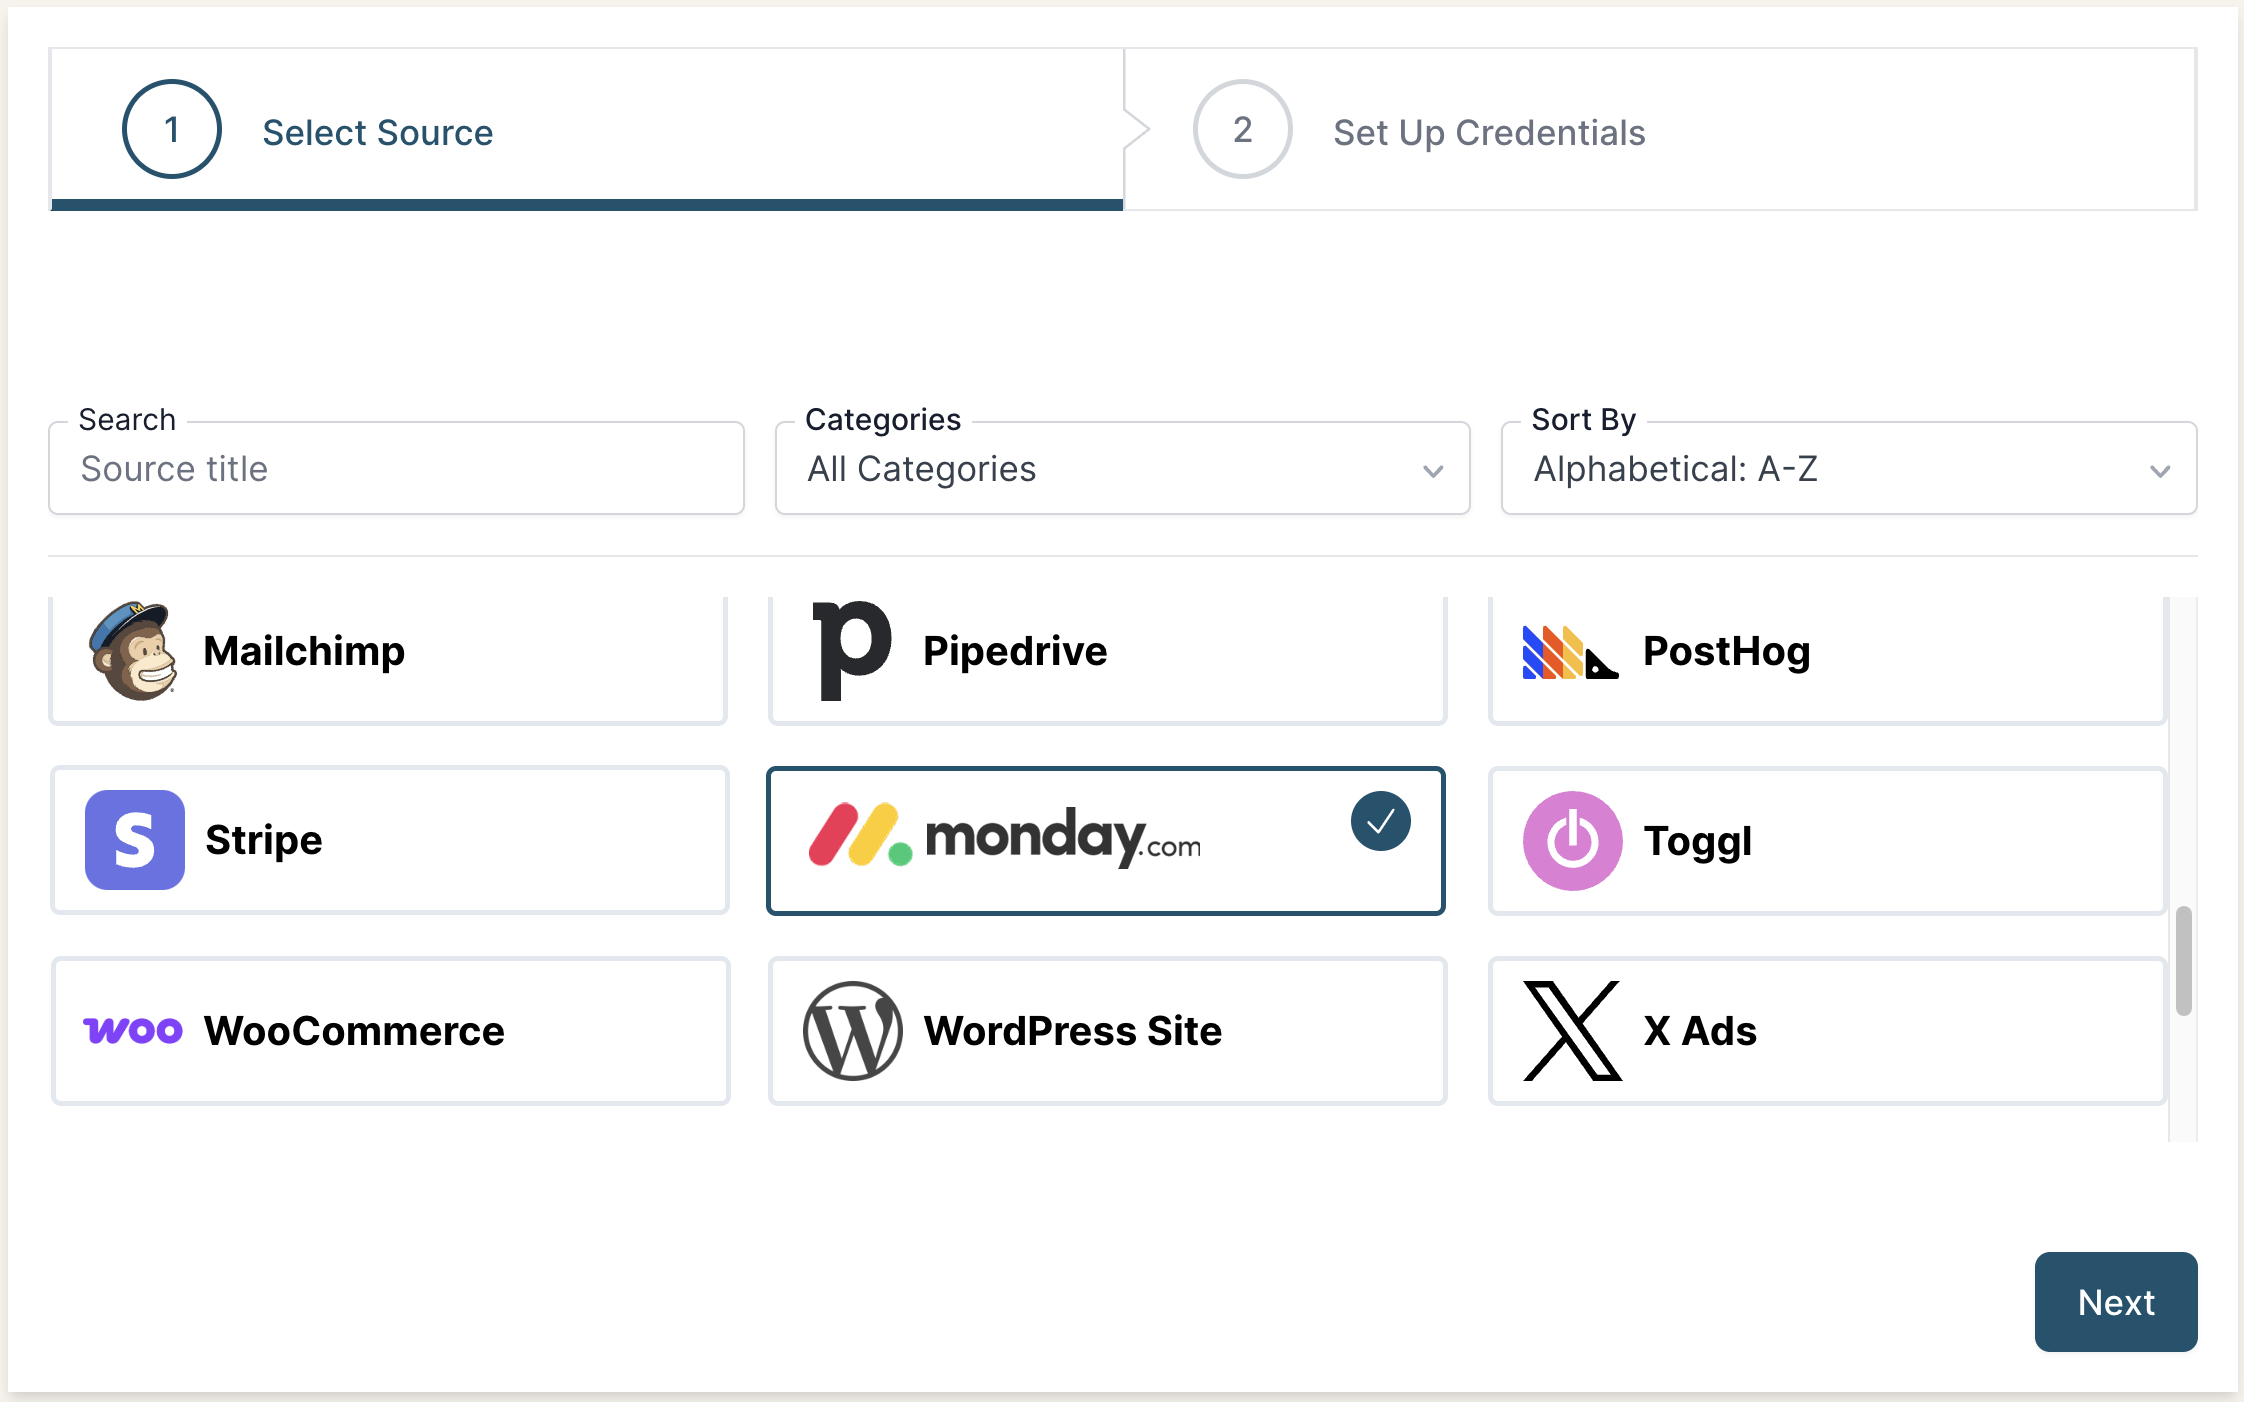
2. Add Connection
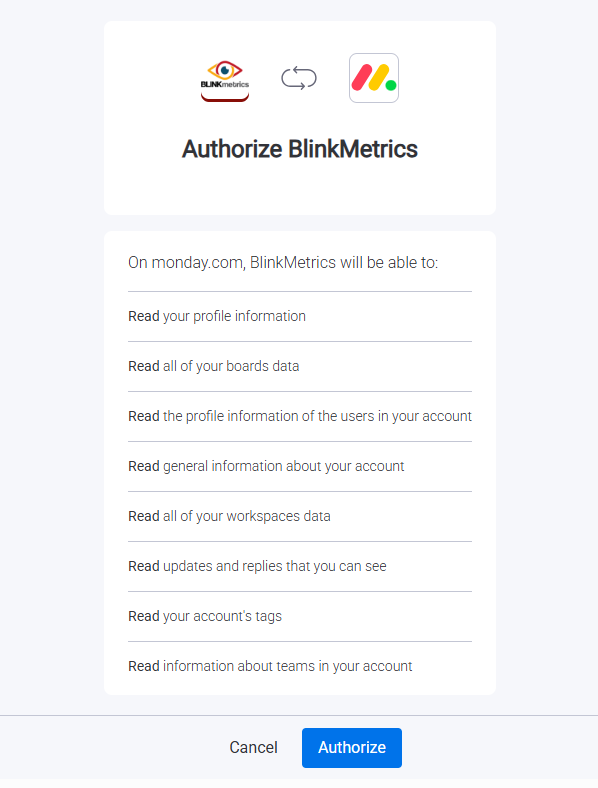
3. Grant Permissions
Complete visibility in 30 days — we'll build you the ultimate monday.com reporting dashboard
Easily see what’s difficult or impossible to see in monday.com
$5000
Custom Reporting Dashboard
(30-Day Sprint)
We craft custom reports to answer every question about your monday.com data.
- 100% done for you
- 4 private workshops over Zoom
- Dedicated data analyst building between workshops
- Automatic data refresh from the Asana API
- Custom dashboard usable within 30 days
- Money-back guarantee
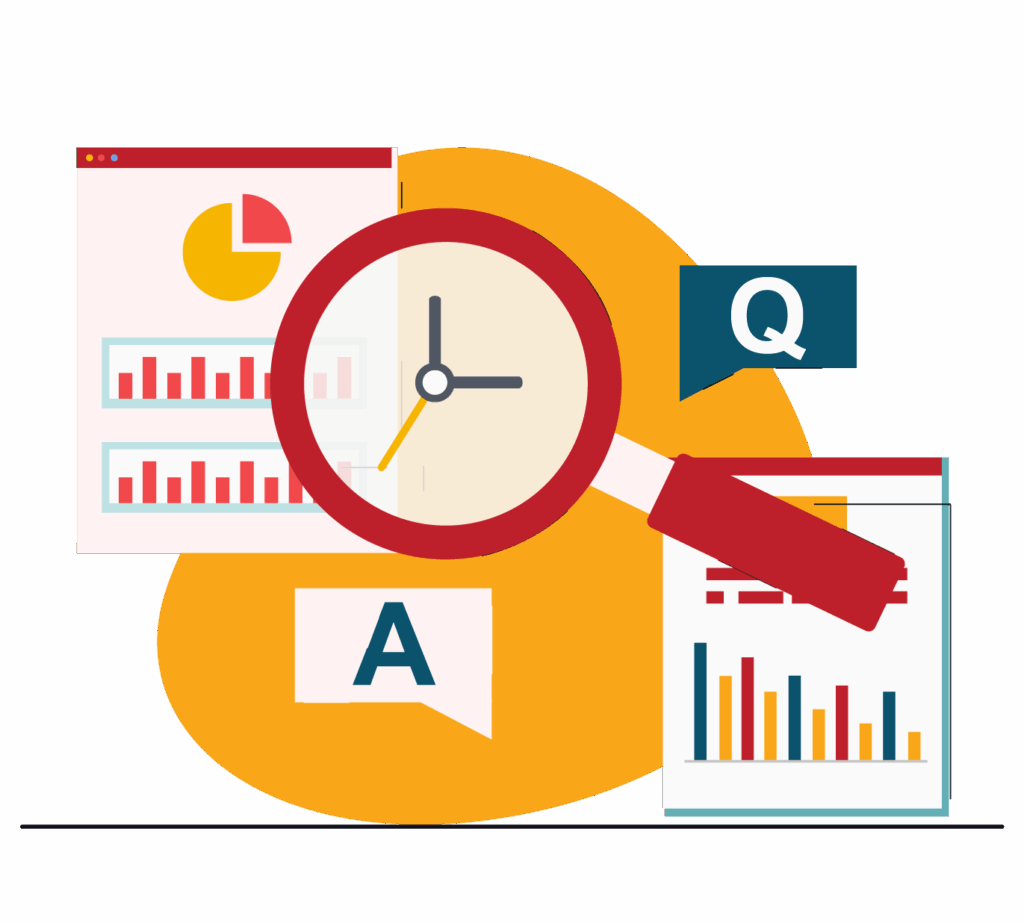
Got questions? We’ve got answers
From setup to smarter reporting, here’s what monday.com users often ask before getting started with BlinkMetrics.
How long does it take to set up BlinkMetrics with monday.com?
Setup is quick and simple. Connect your monday.com account and other data sources in just minutes. No complex tech skills are required—get instant visibility into your metrics without the wait.
Does BlinkMetrics replace monday.com?
No. monday.com stays your project hub—we simply add the reporting depth and analytics it’s missing.
Can I track performance over time?
Yes. We capture daily snapshots so you can see trends across weeks, months, and quarters instead of only today’s numbers.
Will it work if I manage multiple boards?
Absolutely. BlinkMetrics consolidates data from all your boards into unified reports—no more manual exports or merging.
Can I share dashboards with executives or clients?
Yes. We create curated dashboards so each audience gets the view that matters without the noise
How much maintenance is required?
None on your side. Our team sets everything up and maintains your reporting so it runs automatically.
Is there a trial or demo available?
Yes! The best way to see the value is to see it for yourself. Book your demo where we’ll connect your own data and show you the insights you’ve been missing.

Get Clear Answers from Your monday.com Data.
From tracking workloads to measuring project impact, BlinkMetrics delivers the insights that help you work smarter, move faster, and scale with confidence.