
Advanced Asana reporting for businesses that push Asana to its limits
Juggling lots of custom fields, subtasks, projects, and automation rules? You know some of Asana’s frustrating limitations. We fix them.
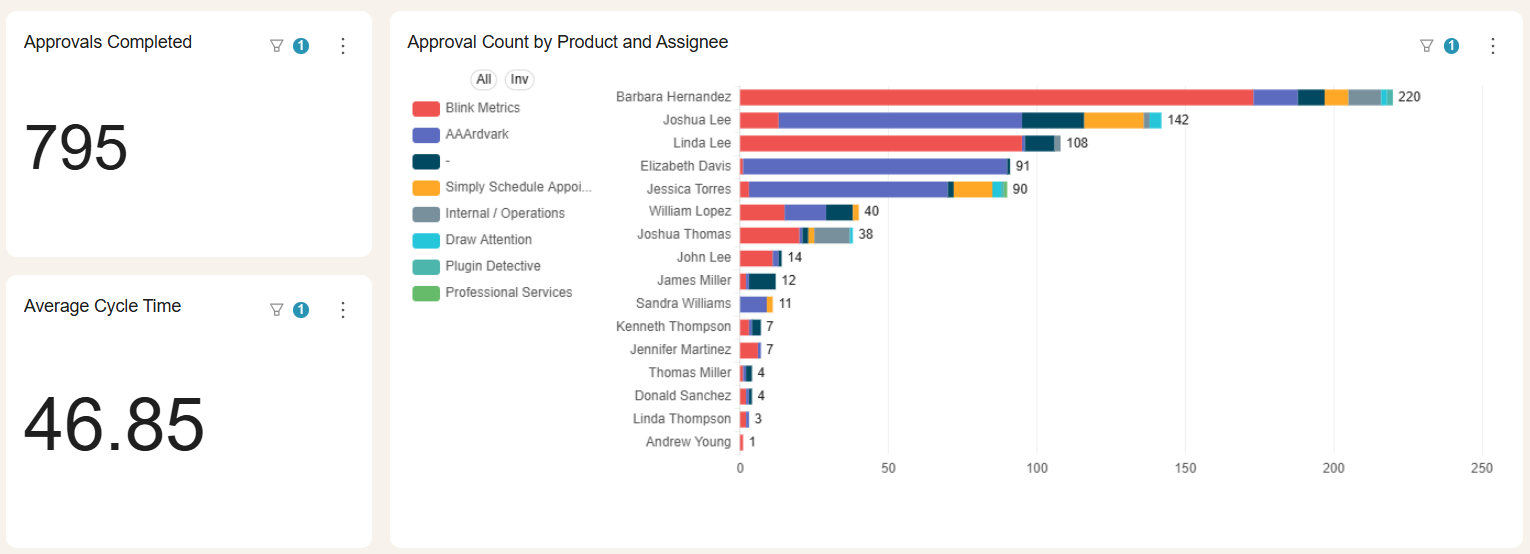
Do you have questions that are difficult or impossible to answer with Asana's built-in reporting?
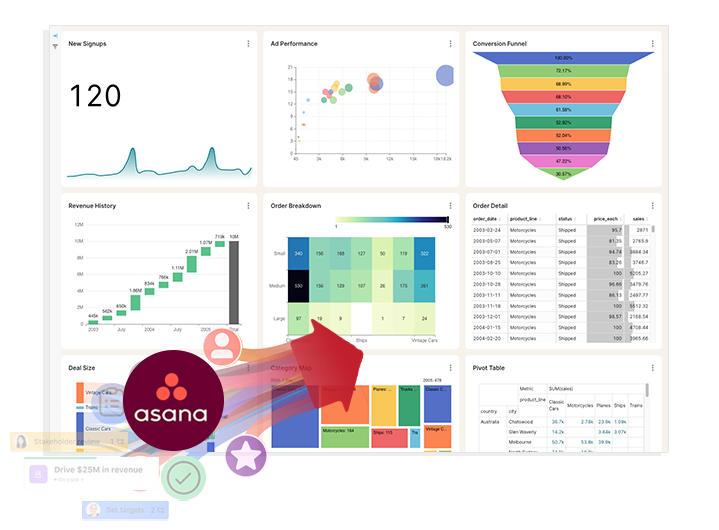
BlinkMetrics gives you instant visibility into every corner of your Asana workspace.
Feature
Asana Native Reporting
BlinkMetrics for Asana
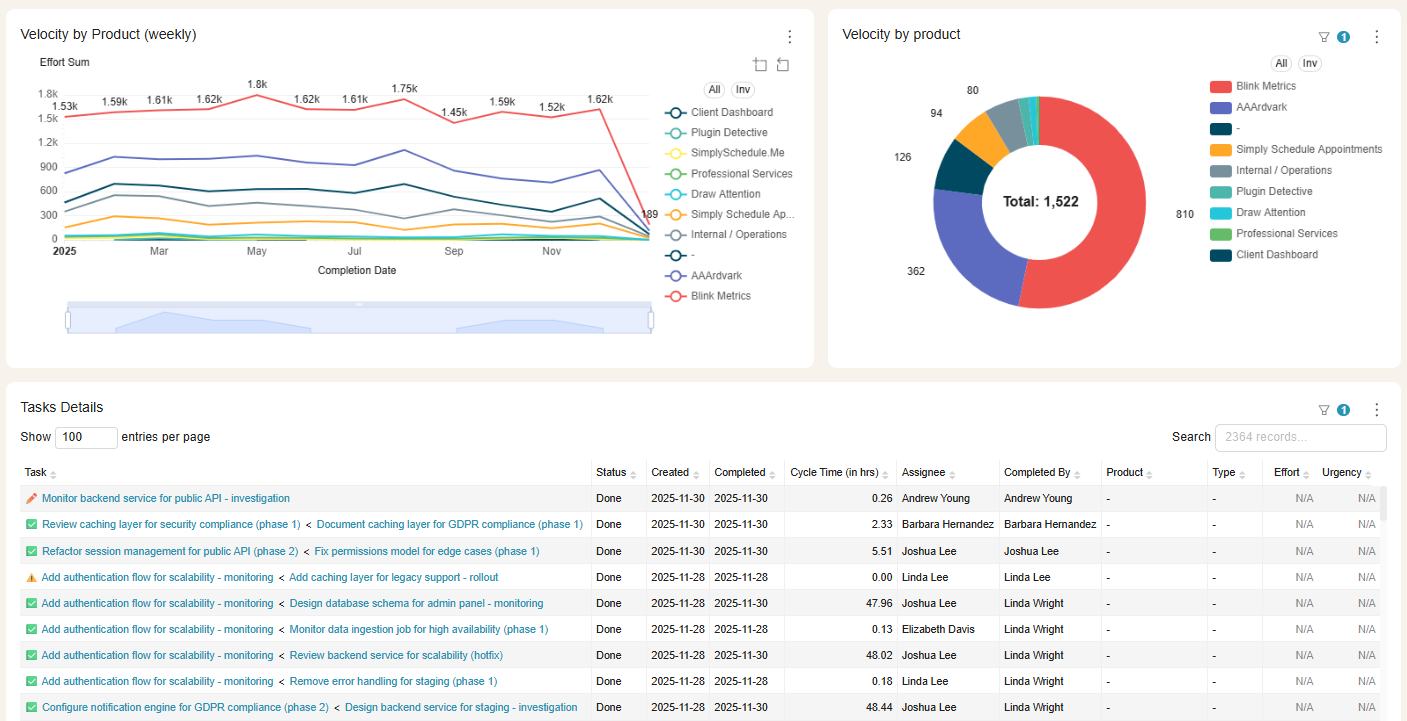
Historical Reporting & Trend Analysis
- Live View Only. Offers a real-time snapshot but no ability to view or report on past data states and trends.
- Complete History. Automatically captures daily snapshots of your data, enabling full historical trend analysis and performance comparison over time.
Custom Filtering & Data Segmentation
- Rigid. Difficult to segment data dynamically by custom fields (e.g., client, product) without creating new, permanent charts.
- Dynamic & Instant. Slice and dice your data in real-time by any field assignee, project, custom properties for on-the-fly analysis.
Reporting Depth
- Basic. Good for top-level project management overview and basic operational data snapshots.
- Advanced Analytics with custom reporting, historical trends, and actionable insights tailored to your workflow.
Cross-Project Dashboards
- Single Project or limited rollup. Does not allow robust blending of multiple projects in one view.
- Multi-Project with robust ability to report on your whole workspace or any blend of the projects within it.
Multi-Source Dashboards
- Asana Only. Does not allow you to connect to other business data sources. You miss out on the power and actionable insights that come from blended reporting.
- Multi-Source. Pull your Asana workspace data plus intel from other systems (marketing, sales, finance, time tracking) into unified dashboards for new clarity.
Global Filters
- No Global Filter. Filtering by date range or other parameter has to be done on a per-widget basis across each dashboard widget. There is no global filter for a dashboard.
- Multiple Global Filters. Unified custom filters let you switch date ranges, teams, or portfolios across the entire view in one step.
Dashboard Design
- Restricted. Your dashboard is restricted to the pre-existing widgets and layouts in Asana's library.
- Custom Build. Your custom done-for-you dashboard is designed to support your workflow and answer your unique business questions.
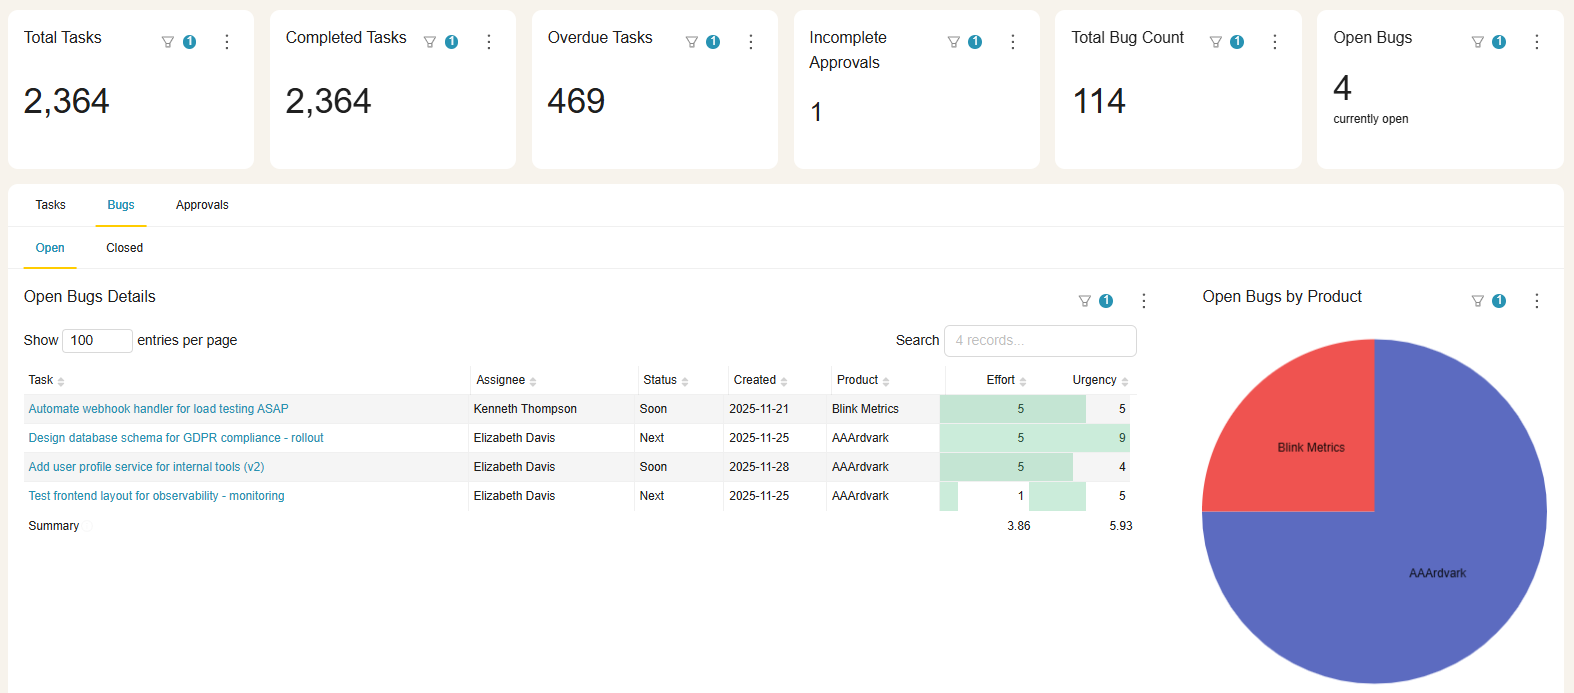
Calculated Metrics, KPIs, & Formulas
- Limited Options for calculated KPIs, ratios, or custom performance metrics. Teams are forced to export into spreadsheets for anything beyond simple counts and statuses.
- Robust custom and calculated metric functionality across 1+ tool sources, designed around your unique business reporting needs and incorporated directly into your dashboards.
Planned vs. actual (budget / effort)
- No Support for comparing planned versus actual costs or effort, and limited support for budget tracking and cost variance across projects.
- Reports on variances. Connects Asana with financial or time‑tracking data to show planned vs. actual effort and spend, making it easy to surface over‑budget work and projects trending off plan.
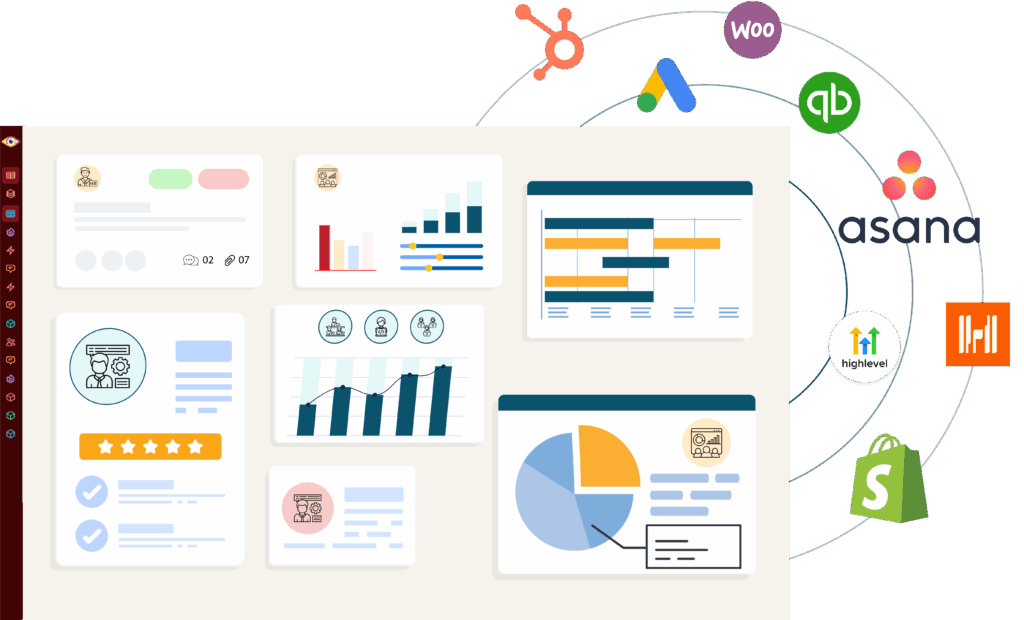
Want to Add Even More Context? Connect Entire Work Ecosystem
Once your Asana reporting is under control, you can plug in marketing, sales, finance, or time‑tracking tools to see how work in Asana connects to real outcomes. BlinkMetrics becomes the hub that explains not just what is happening in Asana, but what it means for the business.
- Connect Department Data: See Asana projects alongside marketing results, sales figures, or financial metrics in the same dashboard.
- Add Time & Resource Tracking: Blend in data from tools like Toggl or Harvest to see true project costs and team capacity.
- Break Down Information Silos: Get a complete picture of how different parts of your business connect and impact project success.
Think of it as a bonus: First we fix your Asana reporting, then we help you see the bigger picture with unified data connectivity.
See BlinkMetrics in action
Move beyond Asana’s surface-level reports. See how our integration uncovers the hidden insights and operational clarity your business has been missing.
Complete visibility in 30 days — we'll build you the ultimate Asana reporting dashboard
Easily see what’s difficult or impossible to see in Asana
$3000
Your custom reporting dashboard
Done in 30 days.
We craft custom reports to answer every question about your Asana data.
- 100% done for you
- 4 private workshops over Zoom
- Dedicated data analyst building between workshops
- Automatic data refresh from the Asana API
- Custom dashboard usable within 30 days
- Money-back guarantee
Have questions about what's possible or how this works?
These are the questions we get most frequently, but we’d love to talk with you on a quick call.
Do you handle the setup, or will my team need to do it?
Your BlinkMetrics dashboard is fully done-for-you. No coding or developers are required. You just tell us what you want and our team builds it.
How long does it take to get my BlinkMetrics + Asana dashboard live?
Setup is quick and simple. Connecting your Asana account and other data sources takes just a few minutes. Our team will deliver your custom dashboard in 30-days or less.
What happens during a BlinkMetrics + Asana demo?
Meet with our founder, Nathan, to walk through a live BlinkMetrics Asana dashboard and visualize what deeper Asana reporting could look like for you.
What will I see in BlinkMetrics that I can’t get from native Asana reporting?
Native Asana reporting is great for quick snapshots, but it struggles with history, cross‑project trends, and deeper workload or performance analysis. With BlinkMetrics, you can see how your Asana data changes over time, compare projects and teams in one place, and drill into the “why” behind bottlenecks, slippage, and capacity issues.
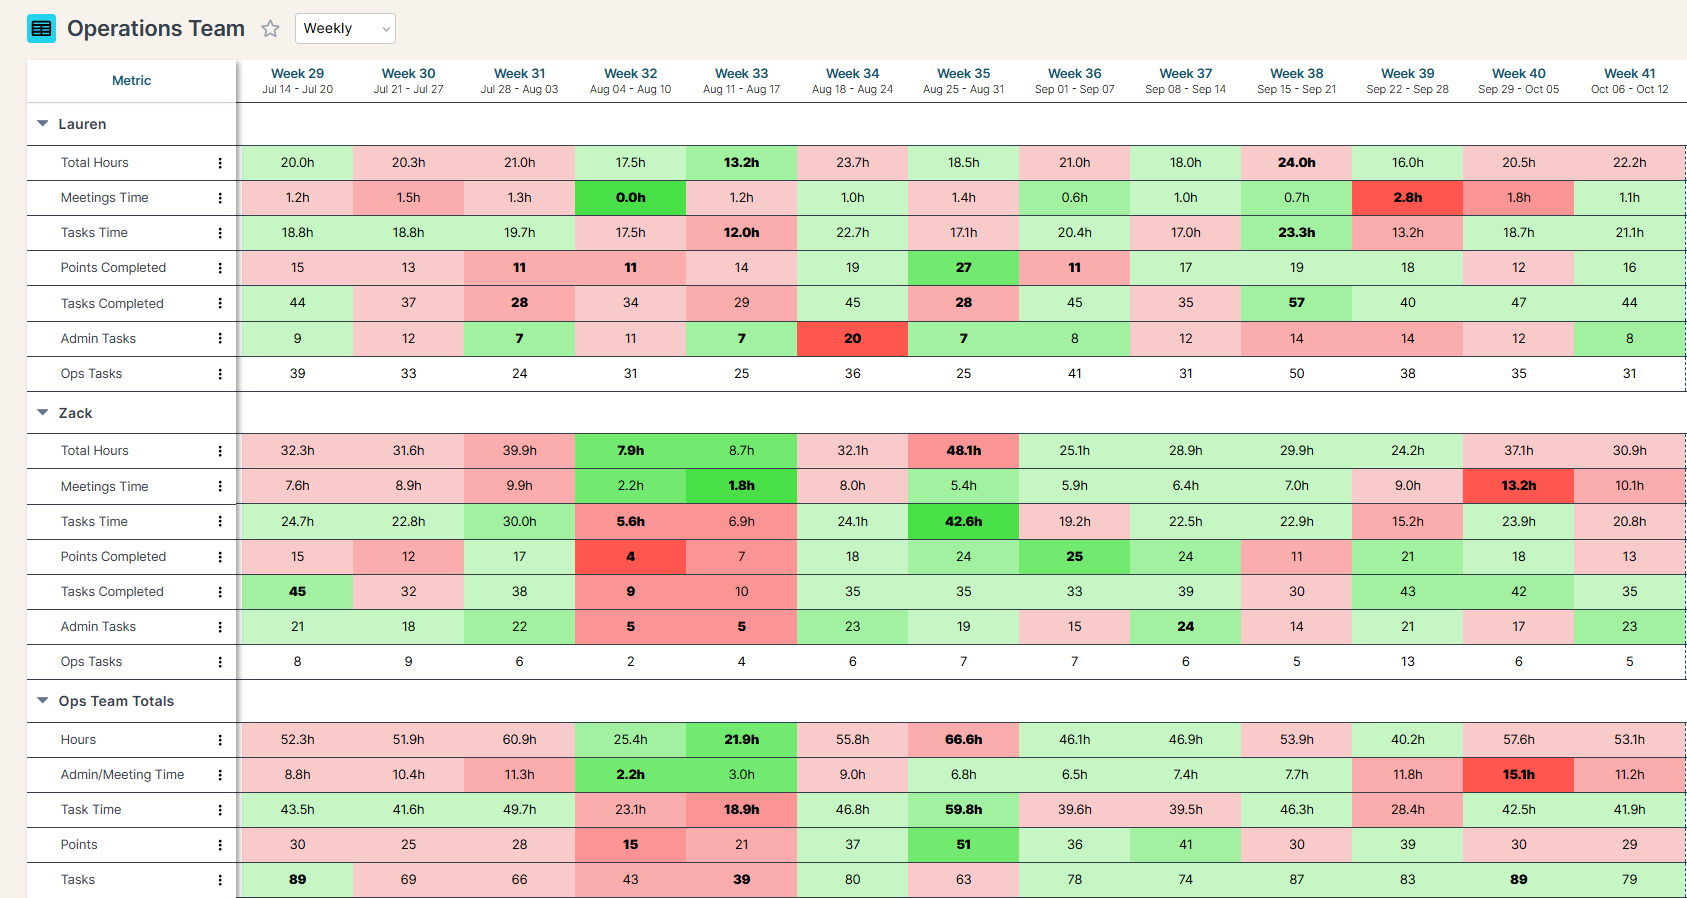
Can BlinkMetrics create custom dashboards or views for different teams and departments?
Yes. We can build focused dashboards for different audiences—operations, leadership, client services, specific departments—using the same underlying Asana data. Each group can get its own views, filters, and KPIs without duplicating work, so people only see what’s relevant to them while you maintain a single source of truth.
How does BlinkMetrics handle historical Asana reporting?
BlinkMetrics takes regular snapshots of your Asana environment and stores them in a dedicated analytics layer. That means you can rewind to see what portfolios, projects, workloads, and key metrics looked like at any point in time, compare periods (like this quarter vs. last), and track trends without manually archiving or exporting data.

Ready for the ultimate
Asana reporting dashboard?
We’ve used Asana since 2010 (yes, really). We have a ton of data in Asana, we have found many reporting gaps, and we have filled them all.