
Customer Support Reporting That Answers Your Most Pressing Questions
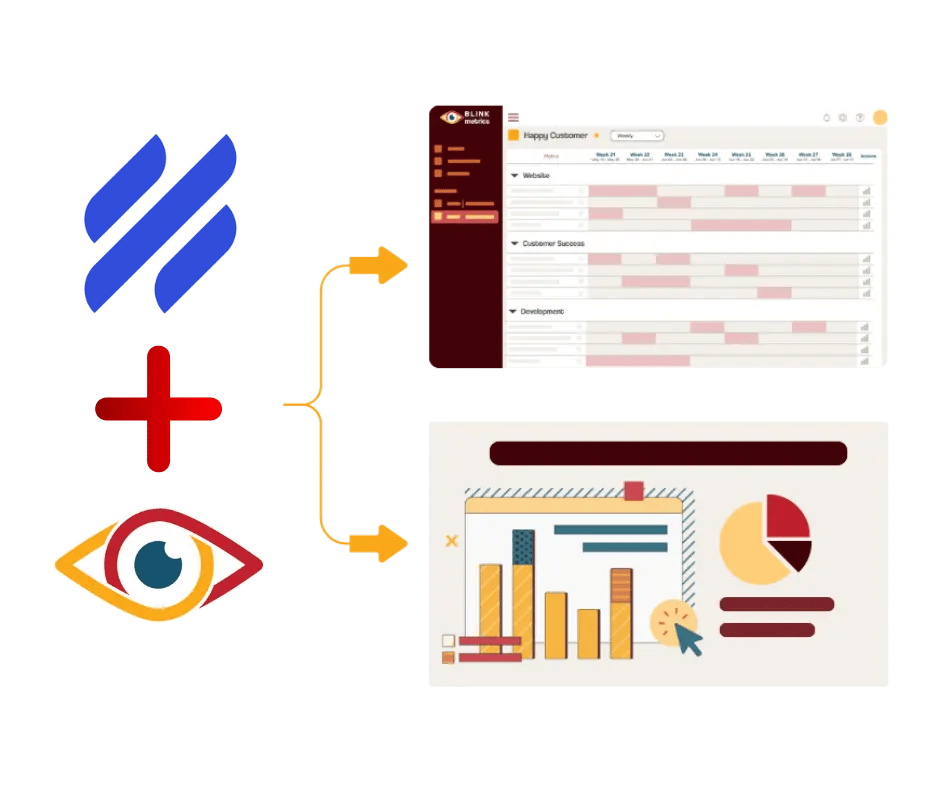
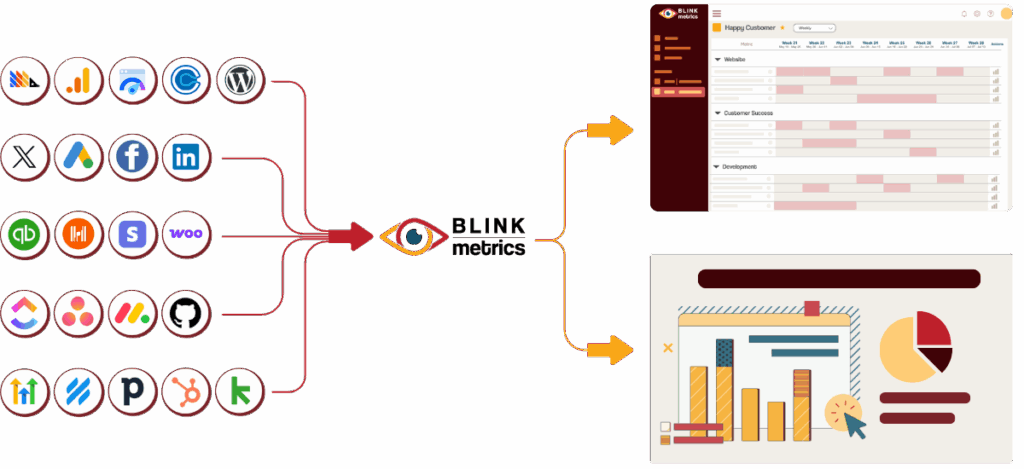
BlinkMetrics connects directly to Help Scout, transforming your support conversations and response times into clear dashboards that reveal how customer service impacts retention, satisfaction, and overall business performance.
The blind spots holding your support team back
Running customer support with Help Scout should feel simple, not frustrating. But if you’re stuck exporting CSVs, switching tabs, and trying to explain trends with limited data… you’re not alone.
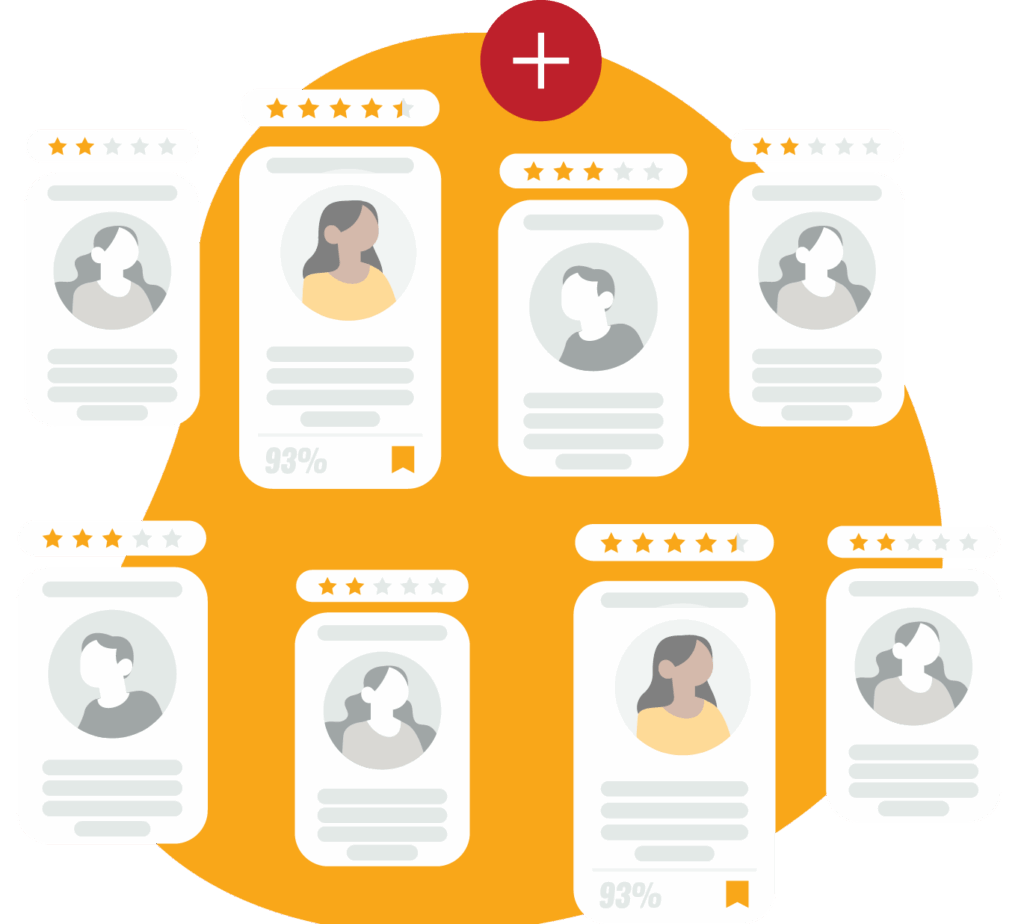
Limited customer visibility
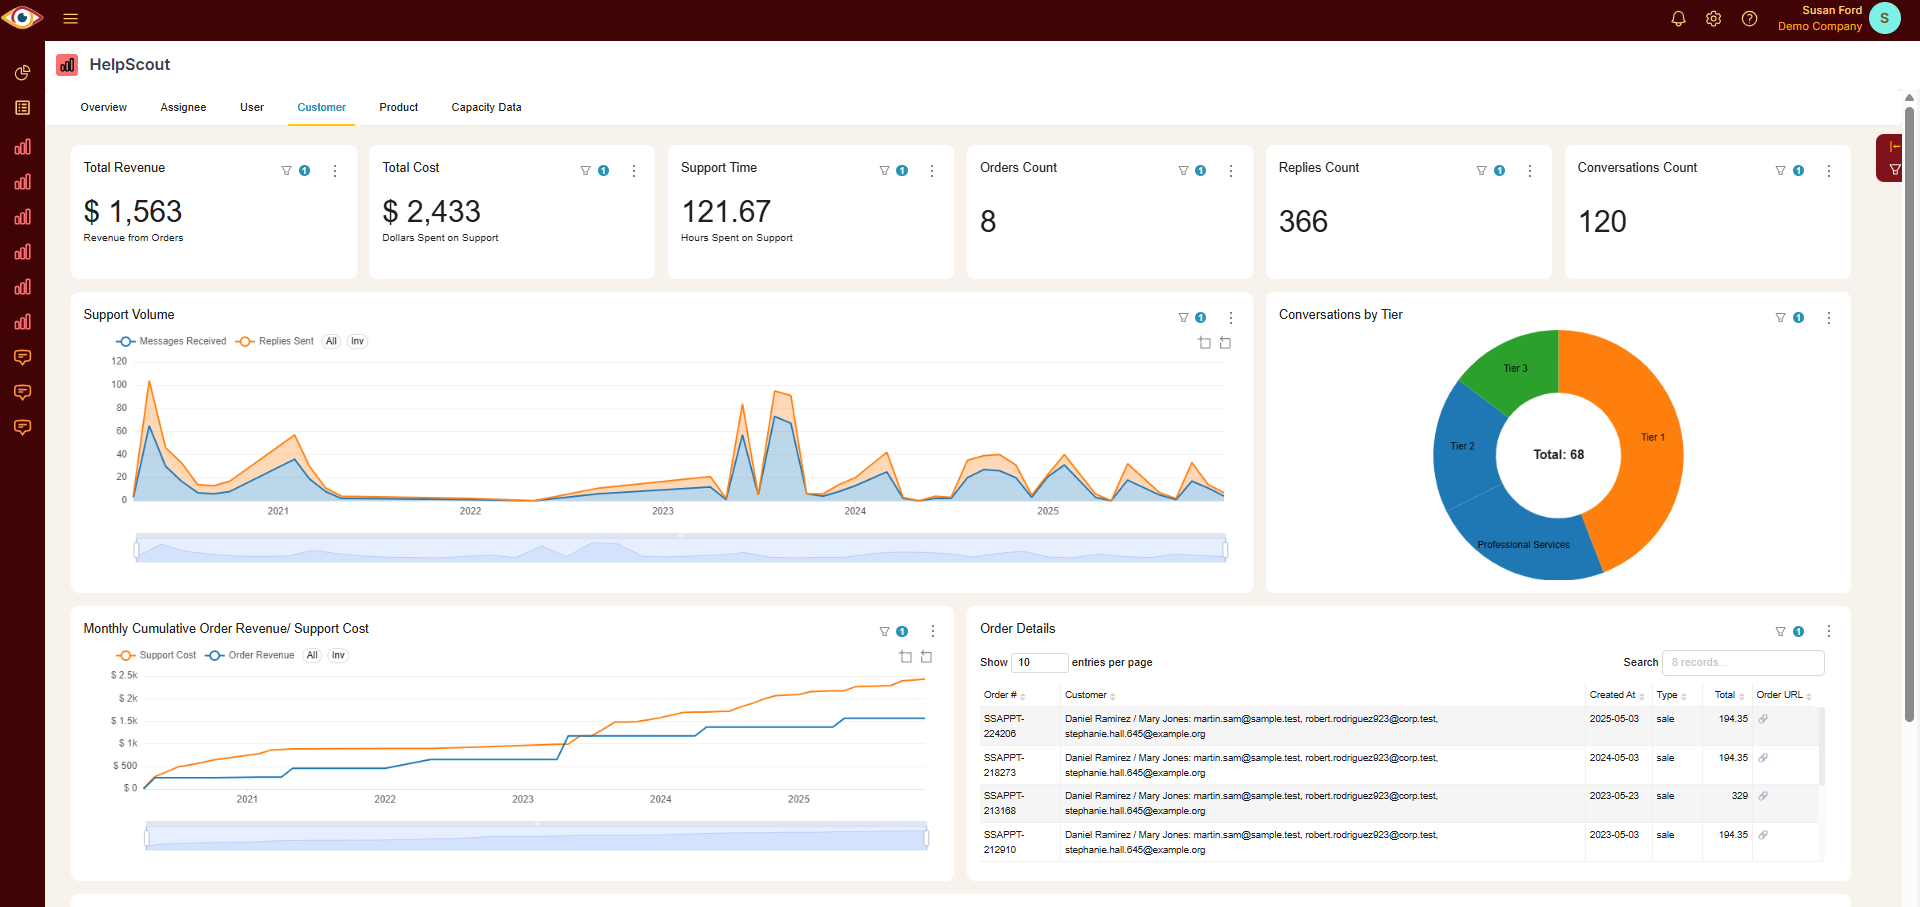
Help Scout gives a solid inbox view, but leaves out deeper insights. You can’t easily see which issues repeat, which customers need the most attention, or how support impacts the bigger business picture.
No long-term or detailed clarity
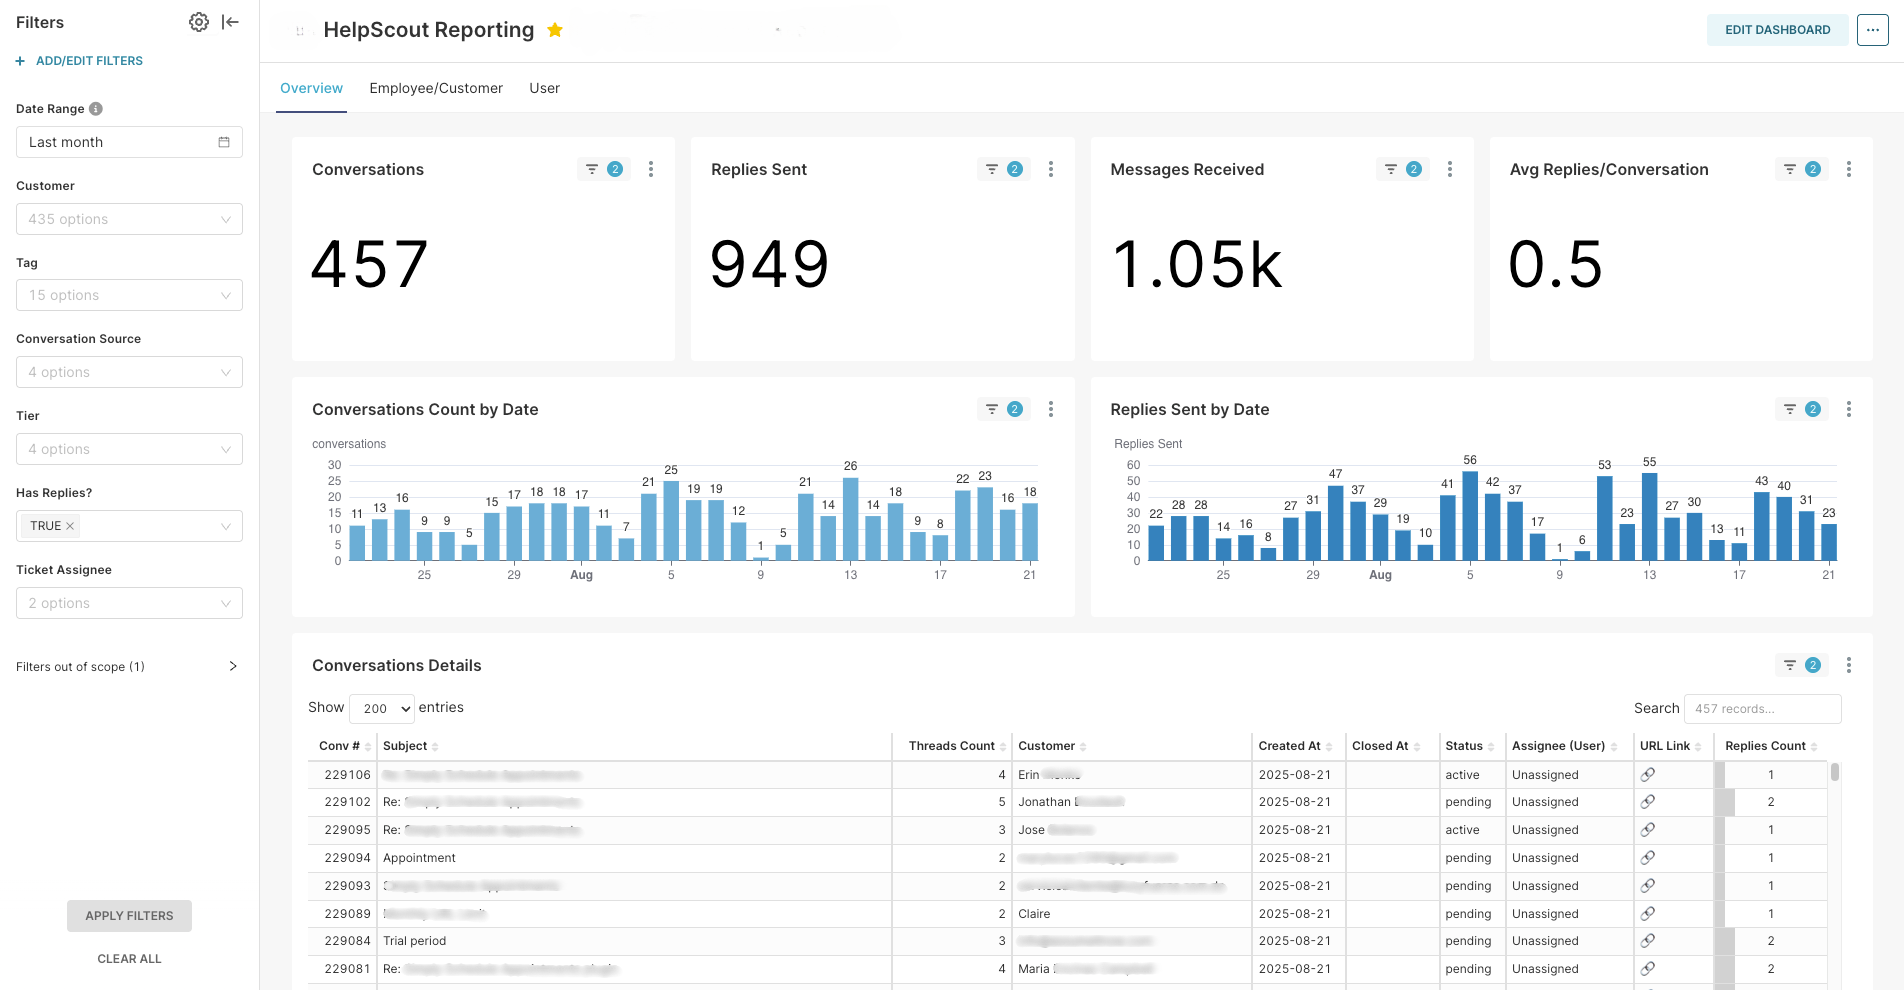
Native reports show surface-level stats, but it’s hard to track trends month over month. Want to know how response times change by team, or which tags tie to churn? That level of clarity isn’t built in.

Team performance confusion
It’s tough to know where bottlenecks happen or which reps are overloaded. Without clear dashboards, you’re left guessing where response times slip, which topics take the most time, or how productivity shifts.
Disconnected data across tools
Support data lives in Help Scout. Marketing lives in other dashboards. Finance lives elsewhere. Without one connected view, leaders struggle to tie support back to sales, retention, or customer happiness.
Everything You Need for Help Scout Success
Scaling support gets easier when you finally have answers to the questions native Help Scout reports leave out. With BlinkMetrics, you see the insights that matter so you can act with confidence every day.
Scaling support gets easier when you finally have answers to the questions native Help Scout reports leave out. With BlinkMetrics, you see the insights that matter so you can act with confidence every day.
BlinkMetrics keeps your support team focused, efficient, and ready to scale. From ticket trends to Docs usage, you’ll know exactly where to improve so customer service stays fast, personal, and effective.
No Code | White Glove Setup | 5-Star Customer Service
BlinkMetrics keeps your store lean, profitable, and primed for growth. From inventory to marketing, you’ll know exactly where to focus to unlock smarter, faster scaling.
No Code | White Glove Setup | 5-Star Customer Service
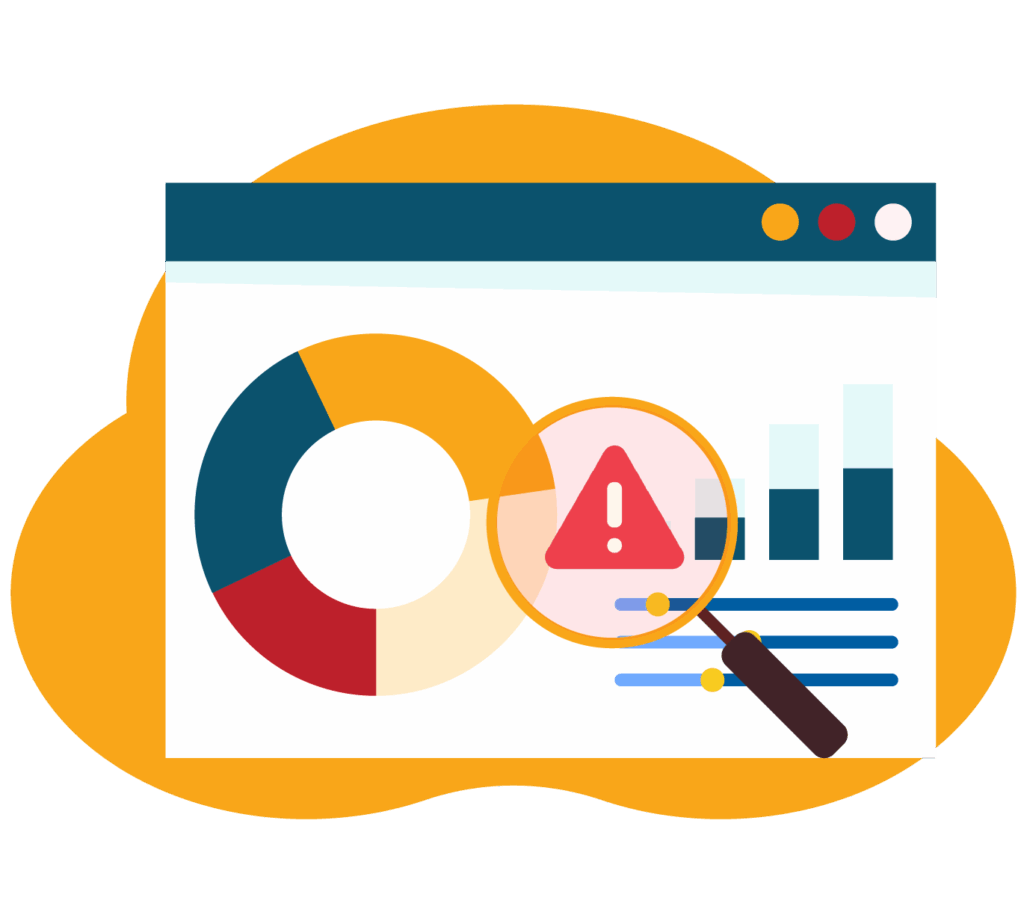
Catch repeat issues before they overwhelm your team
Native Help Scout reports don’t always reveal the patterns behind tickets. BlinkMetrics highlights recurring tags and problem areas so you can fix root causes early.
Spot knowledge gaps and improve self-service
Track Docs performance with clarity. See which articles reduce tickets, where searches fail, and how to build a stronger knowledge base that saves your team time.
Measure and boost team performance
Understand response times by rep, volume by tag, and where workloads pile up. BlinkMetrics gives you clear visibility into productivity so you can staff and coach with confidence.
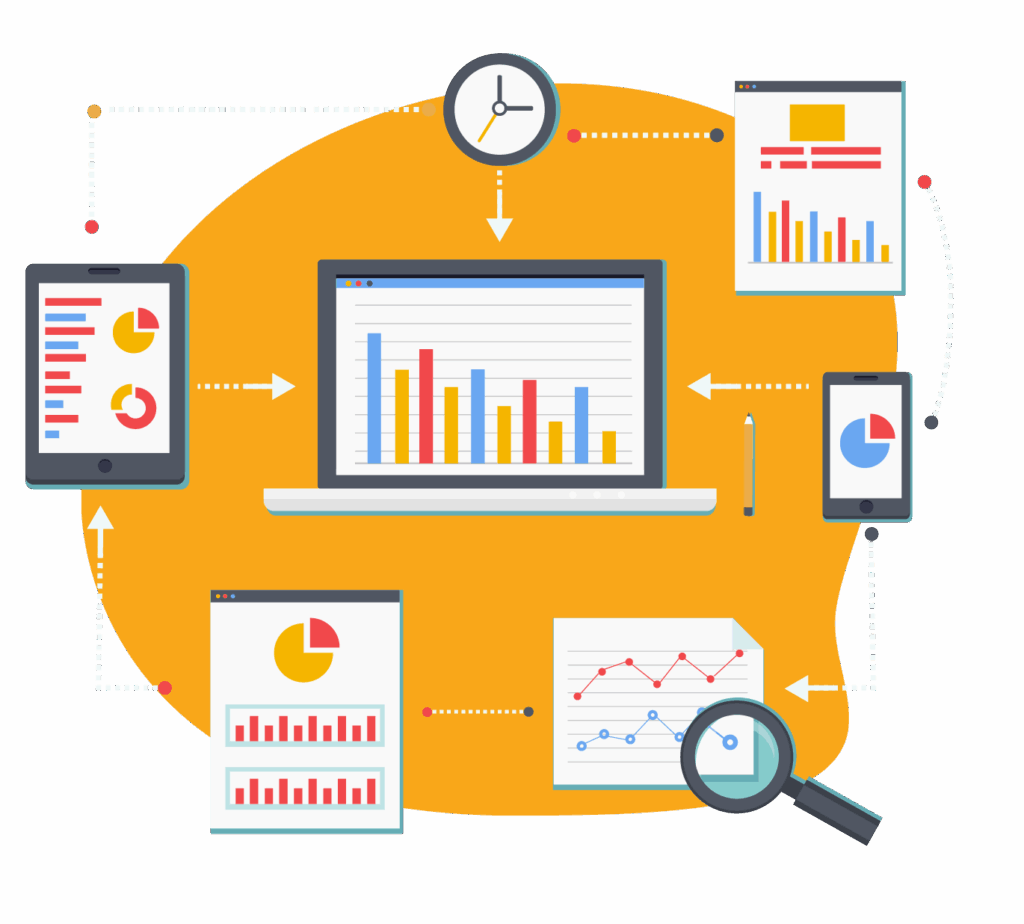
Keep a long-term view of customer trends
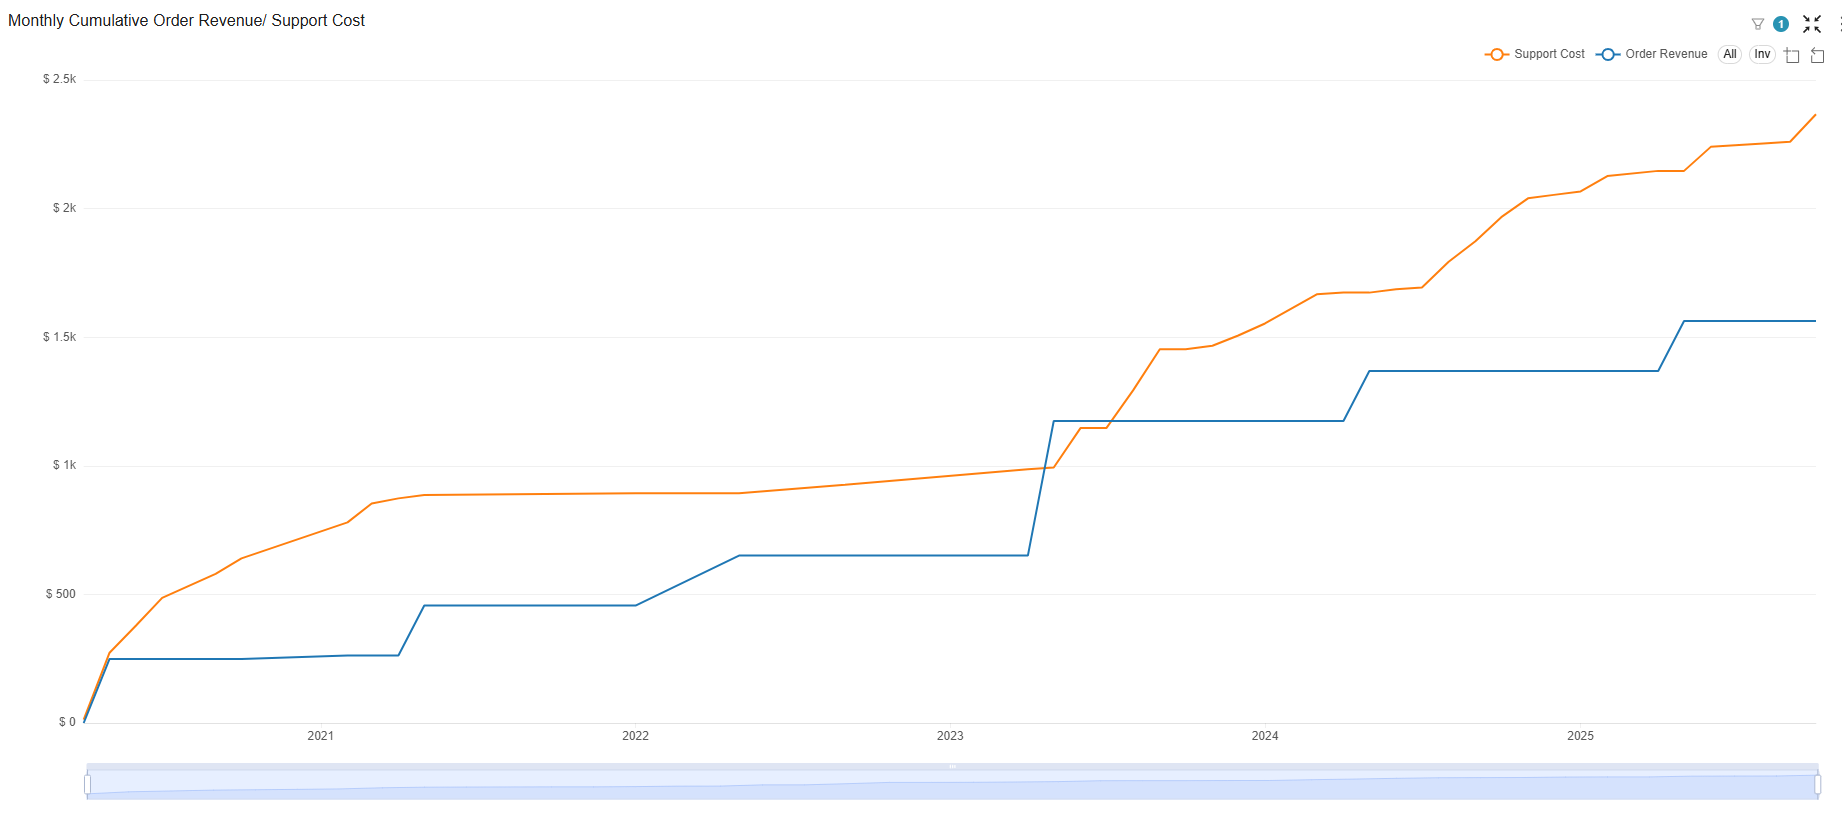
Native reports give snapshots, but BlinkMetrics keeps your data history for months or years. That means you can track how issues, satisfaction, and response times evolve and make strategic improvements backed by trends.
One View. All Your Data.
Layer Help Scout with the other platforms you rely on: CRM, marketing, finance, sales, and more inside one clean BlinkMetrics dashboard.
Eliminate blind spots by combining support data with every other critical metric your business depends on.
Connect the dots across teams: see how support volume affects retention, how Docs reduce sales churn, and how customer behavior shapes your bottom line.
BlinkMetrics gives you the complete picture, so every department works from the same truth.
See BlinkMetrics in action
Go beyond generic reports, watch how our Help Scout integration uncovers hidden insights and delivers the clarity your team has been missing.
Seamless integration with Help Scout
Connect BlinkMetrics to your Help Scout account in minutes, no complex setup, no technical headaches, just instant visibility into the metrics that matter.
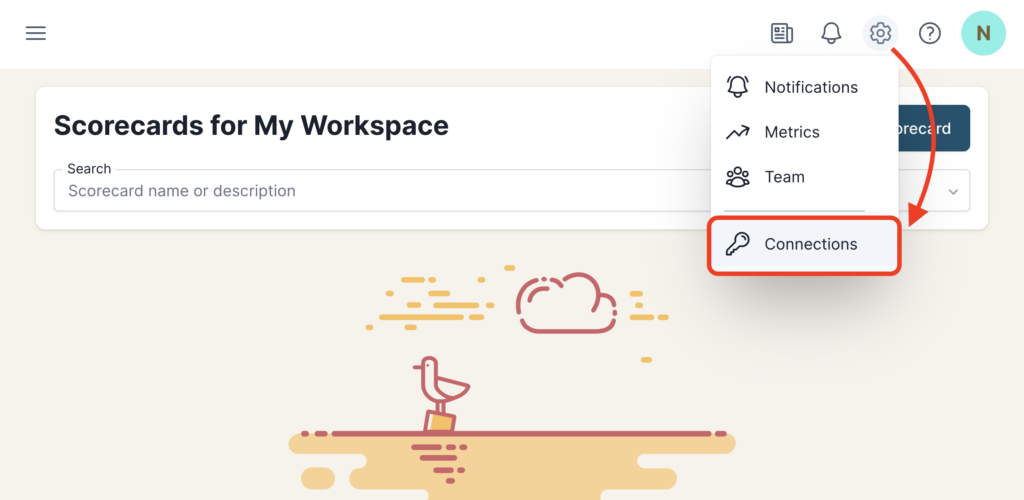
1. Go to the Connections Page

2. Add Connection

3. Review Privacy and Save Connection
Got questions? We’ve got answers
From setup to reporting, here are the most common questions agencies ask before getting started with BlinkMetrics.
How long does it take to set up BlinkMetrics with Help Scout?
Setup is quick. Most businesses connect their Help Scout account and start seeing data within minutes. No complex tech skills required.
Do I need a developer to integrate BlinkMetrics?
No. You don’t need a developer our white-glove team handles the entire setup for you. Your Help Scout data is delivered ready to use.
What type of insights will I see beyond Help Scout’s reports?
With BlinkMetrics, you’ll see deeper insights like long-term trends, team performance by workload, recurring ticket patterns, Docs effectiveness, and how support impacts sales and retention, all beyond Help Scout’s native reports.
Can I combine data from other tools besides Help Scout?
Yes. BlinkMetrics supports multiple data sources, so you can view Help Scout metrics alongside data from your other platforms in one dashboard.
Will my data stay secure?
Absolutely. BlinkMetrics uses encrypted connections and industry-standard security protocols to keep your data safe and private.
Is there a trial or demo available?
Yes. You can book a free demo with our team to see exactly how BlinkMetrics works with your Help Scout setup.
Trusted by small and medium businesses using WooCommerce every day
Before BlinkMetrics, running my WooCommerce store felt like guesswork. I had sales data in one place, inventory in another, and no way to see the big picture. Now everything connects , I can track customer behavior, inventory, and revenue trends all from one dashboard.
— Sarah L., Agency Owner
We sell specialty coffee online, and margins used to feel like a mystery. With Blinkmetrics, I can track profit per product, see customer lifetime value, and reorder inventory with confidence.
— Katie S., Coffee Roastery Manager
Running a WooCommerce apparel store, I was drowning in spreadsheets just to see what sizes and styles were actually profitable. Blinkmetrics shows me instantly which products drive repeat buyers and which ones sit on the shelf.
— Rachel P., Clothing Store Owner
Blinkmetrics gave me answers WooCommerce never could. Now I know exactly which products drive repeat buyers and which ones just drain my cash flow.
— David K., Ecommerce Manager

Your Burning Help Scout Questions, Finally Answered
From response times to Docs performance, discover the insights that help your team deliver faster, smarter, and more confident support.