
Advanced Pipedrive reporting for teams that push Pipedrive to its limits
Juggling surface-level dashboards, messy exports, and unclear team member views? You know some of Pipedrive’s frustrating reporting limitations. We fix them.
Do you have questions that are difficult or impossible to answer with Pipedrive's built-in reporting?
BlinkMetrics gives you instant visibility into every corner of your Pipedrive account.
Feature
Pipedrive Native Reporting
BlinkMetrics for Pipedrive
Historical Reporting & Trend Analysis
- Live View Only. Offers a real-time snapshot but no ability to view or report on past data states and trends across pipelines, reps, and regions.
- Complete History. Automatically captures daily snapshots of your data, enabling full historical trend analysis and performance comparison over time.
Custom Filtering & Data Segmentation
- Rigid. Difficult to segment data dynamically by custom fields, activities, and outcomes. The Lite and Growth plans don't support custom field or team reporting.
- Dynamic & Instant. Slice and dice your data in real-time by any assignee, pipeline, team, activity type, or custom property for on-the-fly analysis.
Reporting Depth
- Basic. Good for top-level project management overview and basic operational data snapshots.
- Advanced Analytics with custom reporting, historical trends, and actionable insights tailored to your workflow.
Multi-Source Dashboards
- Pipedrive Only. Does not allow you to connect to other business data sources. You miss out on the power and actionable insights that come from blended reporting.
- Multi-Source. Pull your Pipedrive account data plus intel from other systems (marketing, project management, finance, time tracking) into unified dashboards for new clarity.
Dashboard Design
- Restricted. Your dashboard is restricted to the pre-existing default layouts in Pipedrive's library unless you upgrade to the Premium or Ultimate plans.
- Custom Build. Your custom done-for-you dashboard is designed to support your workflow and answer your unique business questions.
Calculated Metrics, KPIs, & Formulas
- Limited Options for calculated KPIs, ratios, or custom performance metrics. Teams are forced to export into spreadsheets for anything beyond simple counts and statuses.
- Robust custom and calculated metric functionality across 1+ tool sources, designed around your unique business reporting needs and incorporated directly into your dashboards.
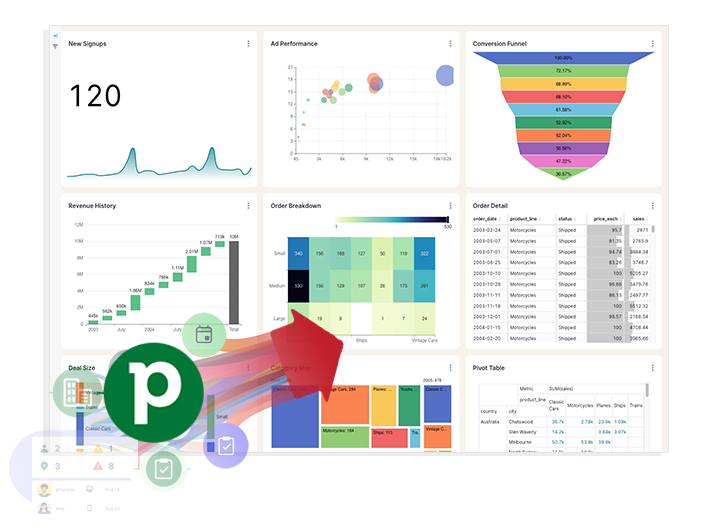
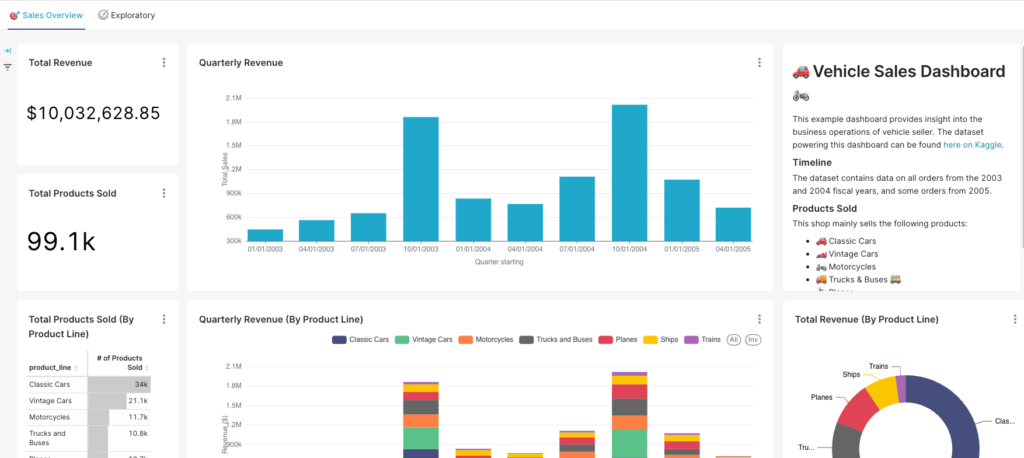
See BlinkMetrics in action
Move beyond Pipedrive’s surface-level reports. See how our integration uncovers the hidden insights and operational clarity your business has been missing.
Complete visibility in 30 days — we'll build you the ultimate Pipedrive reporting dashboard
Easily see what’s difficult or impossible to see in Pipedrive
$5000
Your custom reporting dashboard
Done in 30 days.
We craft custom reports to answer every question about your Pipedrive data.
- 100% done for you
- 4 private workshops over Zoom
- Dedicated data analyst building between workshops
- Automatic data refresh from the Pipedrive API
- Custom dashboard usable within 30 days
- Money-back guarantee
Have questions about what's possible or how this works?
These are the questions we get most frequently, but we’d love to talk with you on a quick call.
Do you handle the setup or will my team need to do it?
Your BlinkMetrics dashboard is fully done-for-you—no coding or developers required. You just tell us what you want and our team builds it.
How long does it take to get my BlinkMetrics + Pipedrive dashboard live?
Setup is quick and simple. Connecting your Pipedrive account and other data sources takes just a few minutes. Our team will deliver your custom dashboard in 30-days or less.
What happens during a BlinkMetrics + Pipedrive demo?
Meet with our founder, Nathan, to walk through a live BlinkMetrics Pipedrive dashboard and visualize what deeper Pipedrive reporting could look like for you.
What will I see in BlinkMetrics that I can’t get from native Pipedrive reporting?
BlinkMetrics lets you blend Pipedrive pipeline with revenue, app, or marketing data from other apps to reveal a complete view of customer performance and profitability.
Can BlinkMetrics work with custom fields and pipelines?
Yes. We fully support your custom fields, multiple pipelines, and unique sales stages. Everything is mapped and standardized so you can compare data across teams and segments.

Ready for the ultimate
Pipedrive reporting dashboard?
We use Pipedrive ourselves. We have all our sales data in Pipedrive, we have found many reporting gaps, and we have filled them all.