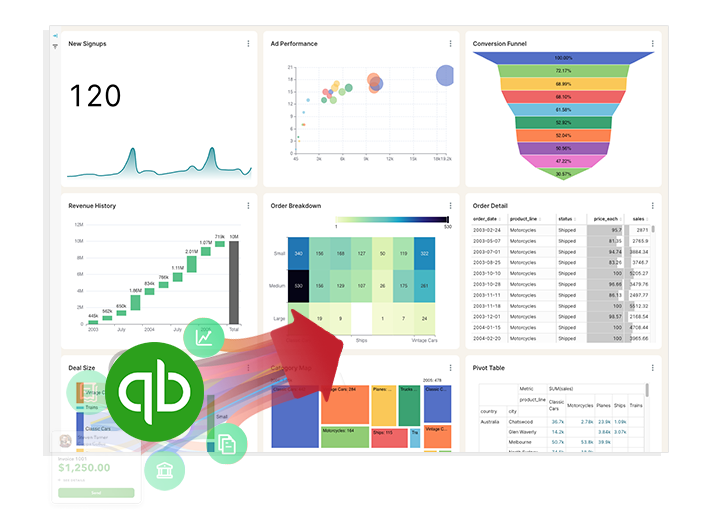
Advanced QuickBooks reporting for businesses that push QuickBooks to its limits
Go beyond revenue totals to see true profitability across clients, projects, and departments. You know some of QuickBooks’s frustrating limitations. We fix them.
Using QuickBooks Online… But Still Can’t Get the Reports Need
You chose QuickBooks Online to bring clarity to your finances. But as your business grows, you’re hitting the limits of its built-in reporting—leaving you with more questions than answers.
Incomplete Picture of Profitability
QuickBooks provides revenue figures but not true profitability, as it doesn’t capture essential project costs, marketing expenses, or support tickets stored in other tools, hindering accurate performance measurement.
Data Trapped in Other Systems
Important business information, such as customer support, project timelines, and marketing metrics, is stored across various platforms. QuickBooks lacks integration, report management and many more.
Manual Reporting Across Tools
You spend countless hours extracting numbers from QuickBooks and merging them with other system data in spreadsheets, leading to inefficiencies, errors, and missed opportunities for real-time insights.
Lack of Real-Time Financial Visibility
QuickBooks lacks proactive alerts for cash flow risks, making it difficult to identify overdue invoices, outstanding payables, or cash gaps without running multiple reports, delaying necessary action.
Deeper Financial Intelligence - Powered by QuickBooks, Perfected by BlinkMetrics
Go beyond QuickBooks’ limits. BlinkMetrics provides the advanced reporting and custom analytics you need to make confident decisions and scale your business.
Go beyond QuickBooks’ limits. BlinkMetrics provides the advanced reporting and custom analytics you need to make confident decisions and scale your business.
BlinkMetrics helps keep your finances lean, insightful, and ready for growth. From cash flow to cost tracking, you’ll know exactly where to focus to unlock smarter, more profitable scaling.
No Code | White-Glove Setup | 5-Star Customer Support
BlinkMetrics helps keep your finances lean, insightful, and ready for growth. From cash flow to cost tracking, you’ll know exactly where to focus to unlock smarter, more profitable scaling.
No Code | White-Glove Setup | 5-Star Customer Support
Catch out-of-stock products before they kill sales
QuickBooks shows you revenue—but not always profitability. BlinkMetrics helps you track margins by product, department, or campaign in real time, so you can pivot before profits disappear.
Forecast Cash Flow with Confidence
Go beyond basic profit and loss statements. Predict upcoming cash gaps, seasonal trends, and growth opportunities using real-time data blended from QuickBooks and your other platforms.
Stop Guessing Which Works are Most Profitable
QuickBooks doesn’t make it easy to see true profitability at a granular level. BlinkMetrics lets you easily analyze performance by client, project, or team—so you can focus on what (and who) drives the most value.
Scale with Strategy—Not Spreadsheets
Growth shouldn’t mean drowning in Excel. With BlinkMetrics, every financial decision is backed by clean, connected, multi-source data. Turn insights into action and make your next growth phase predictable.
Unlimited custom fields, labels, and tracking dimensions
Data Export & Integration
Native integration with QBO + easy export/share options
Collaboration Features
Commenting, sharing, and team-based dashboards
Ongoing Innovation
Continuously improved based on customer feedback
Need Smarter Reporting Without the Headaches?
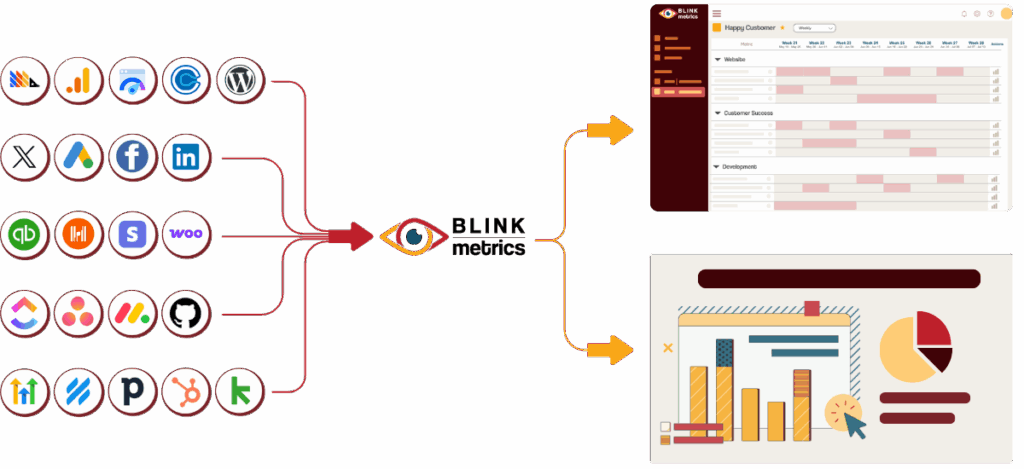
Relying on QuickBooks to manage your books—but you need more than standard reports to truly understand your business. BlinkMetrics seamlessly integrates QuickBooks Online with the other tools you use every day—your CRM, banking platforms, payment processors, and more—unifying everything into one intuitive, actionable dashboard.
Eliminate financial blind spots by bringing all your critical metrics—from cash flow and receivables to project profitability and expense trends—into a single, real-time view.
Connect financial insights across your business. See how sales influence cash flow, how marketing spend impacts customer acquisition cost, and how operational changes affect your bottom line.
Stop juggling spreadsheets and jumping between tabs. Get the unified, deep, and customizable financial intelligence your growing business deserves—all built on the foundation of QuickBooks you already trust.
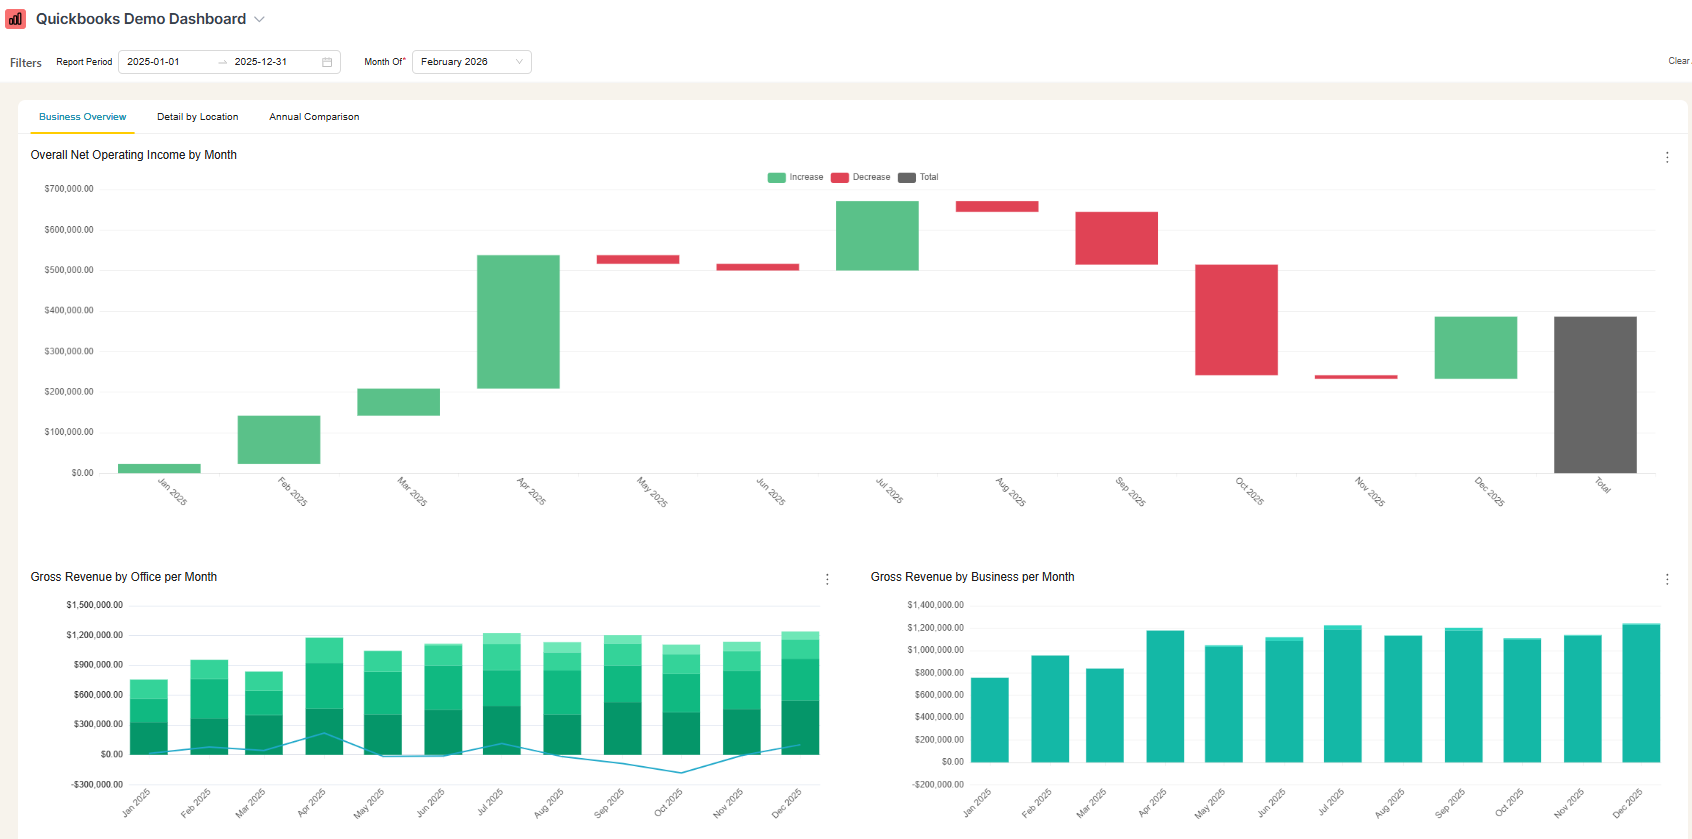
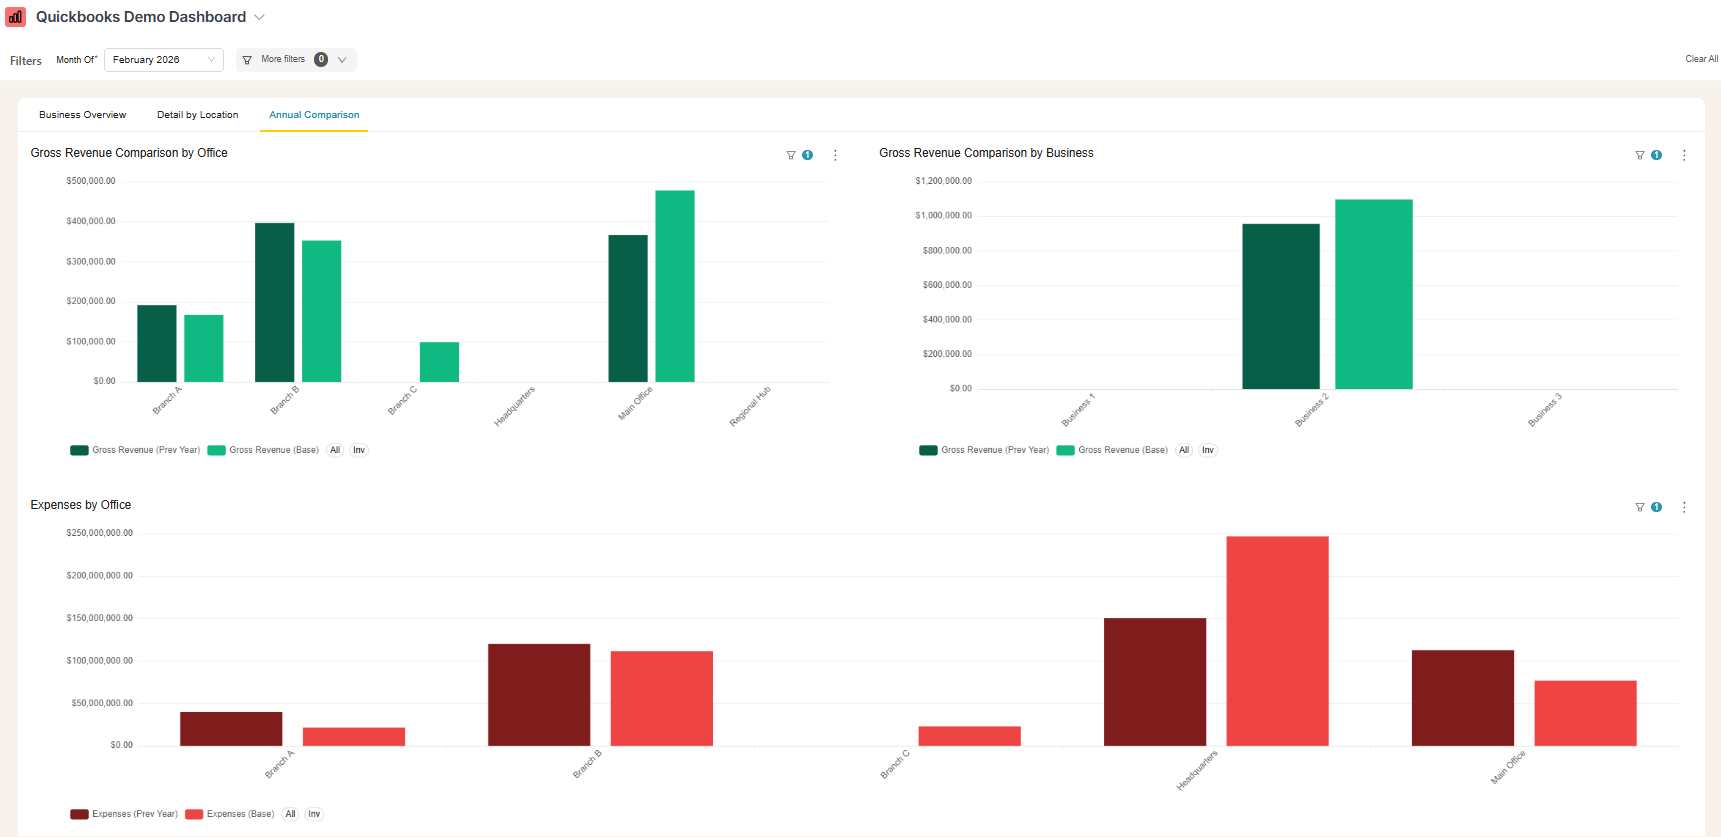
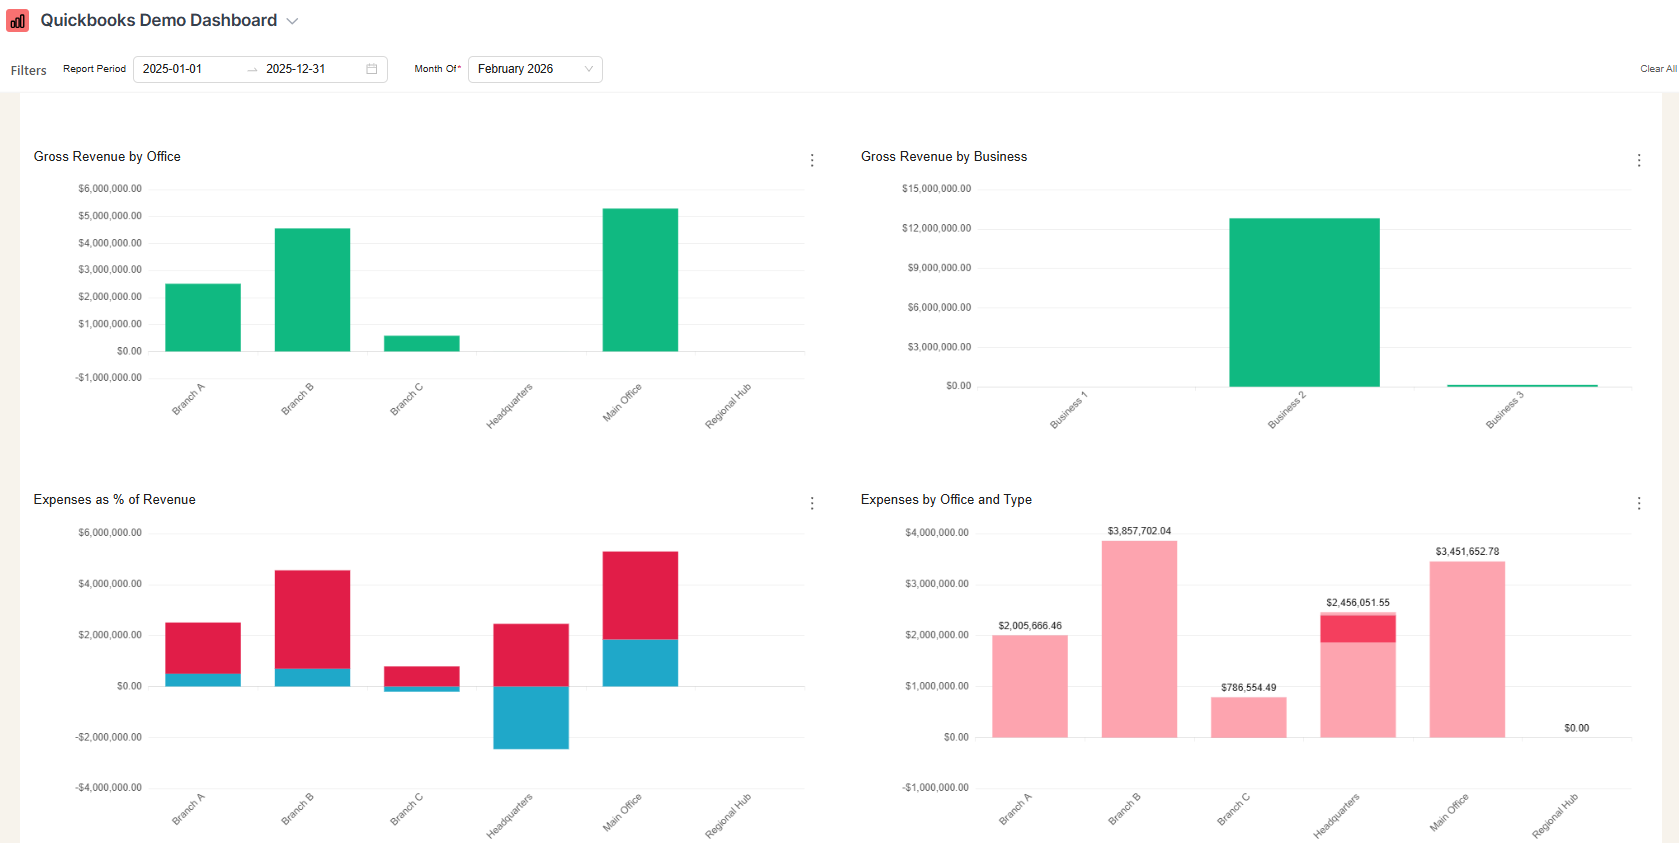
See BlinkMetrics in action
Move beyond QuickBooks’ surface-level reports. See how our integration uncovers the hidden profitability, cash flow, and operational insights your business has been missing.
Do you handle the setup, or will my team need to do it?
Your BlinkMetrics dashboard is fully done-for-you. No coding or developers are required. You just tell us what you want and our team builds it.
How long does it take to get my BlinkMetrics + QuickBooks dashboard live?
Setup is quick and simple. Connecting your QuickBooks account and other data sources takes just a few minutes. Our team will deliver your custom dashboard in 30-days or less.
What happens during a BlinkMetrics + QuickBooks demo?
Meet with our founder, Nathan, to walk through a live BlinkMetrics QuickBooks dashboard and visualize what deeper QuickBooks reporting could look like for you.
Can I combine data from other tools besides QuickBooks?
Yes. Yes. BlinkMetrics supports multiple data sources, so you can view QuickBooks metrics alongside data from your other platforms in one dashboard.
Do you handle the setup, or will my team need to do it?
Your BlinkMetrics dashboard is fully done-for-you. No coding or developers are required. You just tell us what you want and our team builds it.
How long does it take to get my BlinkMetrics + QuickBooks dashboard live?
Setup is quick and simple. Connecting your QuickBooks account and other data sources takes just a few minutes. Our team will deliver your custom dashboard in 30-days or less.
What happens during a BlinkMetrics + QuickBooks demo?
Meet with our founder, Nathan, to walk through a live BlinkMetrics QuickBooks dashboard and visualize what deeper QuickBooks reporting could look like for you.
What will I see in BlinkMetrics that I can’t get from native QuickBooks reporting?
Native QuickBooks reporting is great for high-level overviews, analysis. With BlinkMetrics, you can see how your QuickBooks data changes over time, compare projects and teams in one place, and drill into the “why” behind bottlenecks, slippage, and capacity issues.
Can I combine data from other tools besides QuickBooks?
Yes. Yes. BlinkMetrics supports multiple data sources, so you can view QuickBooks metrics alongside data from your other platforms in one dashboard.