
Looking for Asana dashboard inspiration? This guide is all examples of real dashboard configurations you can replicate for marketing campaigns, product sprints, client projects, and more.
If you need step-by-step instructions on creating dashboards or a deep dive into what Asana’s native dashboards can and can’t do, see our complete Asana dashboard guide. Here, we’ll jump straight into what to build.
Project dashboard examples
Here are four project dashboard configurations worth emulating, organized by team type.
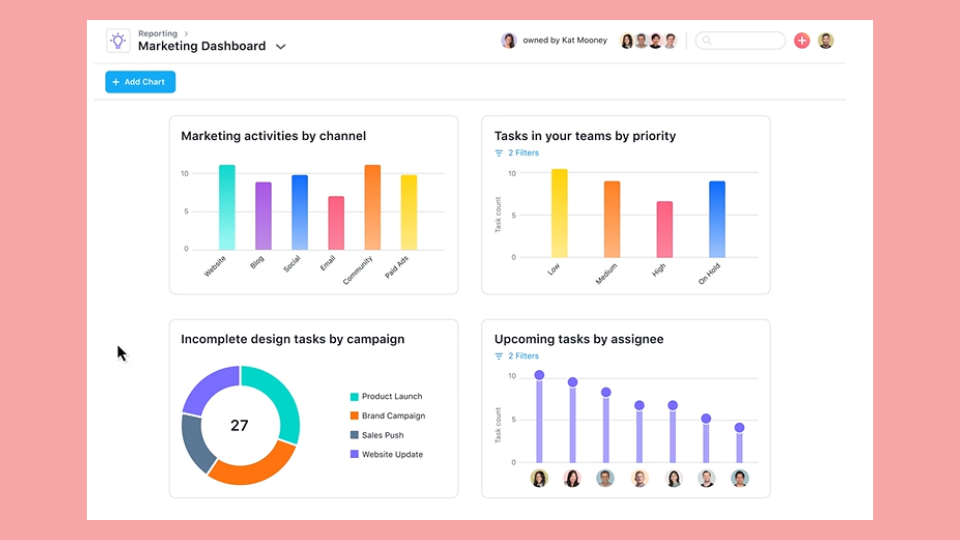
Marketing campaign dashboard
Best for: Marketing teams tracking campaigns, launches, or content calendars
Key widgets:
- Marketing activities by channel (bar chart)
- Task by priority (bar chart)
- Incomplete tasks by campaign (donut chart)
- Upcoming tasks by assignee (lollipop chart)
What this shows: Amount of work, who’s doing what, and how work breaks down by category.
Setup tip: Create a custom dropdown field for “Campaign Type” (e.g., email, social, paid) so you can filter and visualize work by channel.
Product development sprint dashboard
Best for: Product and engineering teams running sprints or release cycles
Key widgets:
- Tasks by section (to visualize kanban stages)
- Incomplete tasks by assignee
- Tasks by priority custom field
- Completed tasks this week
What this shows: Sprint progress, workload distribution, and priority balance.
Setup tip: Use sections for sprint stages (Backlog, In Progress, Review, Done) and add a Priority dropdown field. The dashboard will automatically show how work flows through your process.
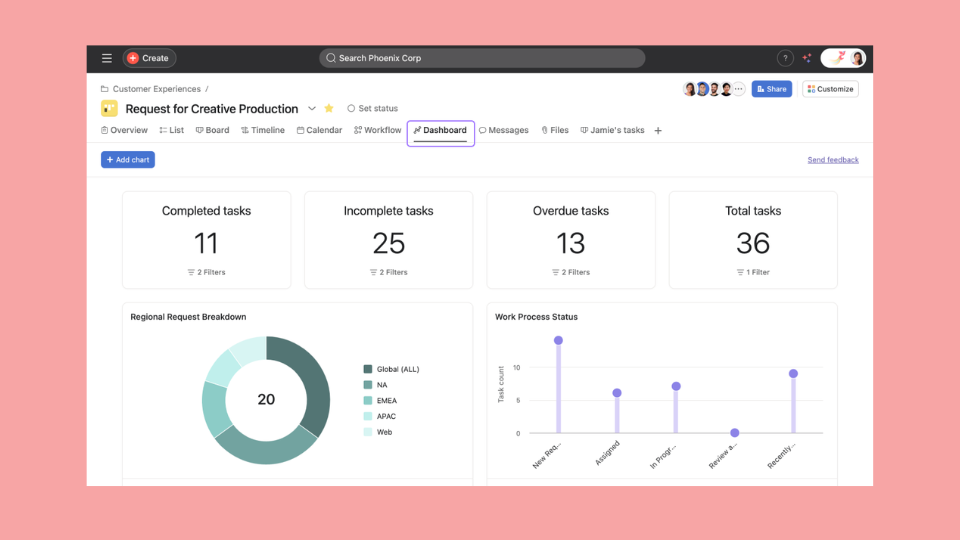
Client project dashboard
Best for: Agencies, consultants, and client services teams
Key widgets:
- Count of Tasks
- Tasks by location (doughnut chart)
- Tasks by process status (lollipop chart)
What this shows: Client deliverable progress, milestone tracking, and potential red flags.
Setup tip: Create milestones for key client deliverables and add a “Deliverable Type” field (e.g., Design, Copy, Development). This lets you show clients exactly where things stand without overwhelming them with task-level detail.
Event planning dashboard
Best for: Event coordinators managing conferences, launches, or internal events
Key widgets:
- Tasks by section (organized by event phase)
- Incomplete tasks count
- Tasks due this week
- Custom field breakdown by vendor or category
What this shows: What’s done, what’s left, and whether you’re on track for the event date.
Setup tip: Organize sections by phase (Pre-event, Day-of, Post-event) and use custom fields to tag tasks by vendor, budget category, or responsible team.
Portfolio dashboard examples
Portfolio dashboards give leadership visibility across multiple projects. Here’s what you can build.
Multi-project status overview
Best for: Program managers, PMOs, and executives tracking multiple initiatives
What it shows:
- Project health status (on track, at risk, off track)
- Status update summaries from project owners
- Start and end dates across the portfolio
How to set it up:
- Create a portfolio and add relevant projects
- Ensure each project has status updates enabled
- View the portfolio’s Status tab for the rollup
The gap: You see current status, but not how status has changed over time. If you need to report “we had 5 projects at risk last month, now we have 2,” you’ll need a tool that captures historical snapshots.
Team workload dashboard
Best for: Managers balancing work across team members
What it shows:
- Hours allocated per person per week
- Over-allocated team members (highlighted in red)
- Unassigned work
How to set it up:
- Enable effort tracking in your projects (hours or story points)
- Add projects to a portfolio
- Open the Workload tab
The gap: Workload is driven by task effort fields (hours or points) and focuses on planned capacity. You can track actual time separately using Asana’s time tracking feature, but Workload doesn’t natively show planned vs. actual capacity over time.
Quarterly goals dashboard
Best for: Teams connecting projects to company objectives
What it shows:
- Goal progress percentages
- Projects linked to each goal
- Rollup of sub-goals
How to set it up:
- Create Goals in Asana (available on Business tier and above)
- Link projects to relevant goals
- View the Goals tab for progress tracking
The gap: Goal progress is calculated from linked projects, but you can’t customize the calculation. If your KPI requires a specific formula (revenue per project, delivery rate, etc.), you’ll need an external tool.
KPI dashboard examples
Tracking KPIs in Asana still requires creativity. Formula custom fields can do basic calculations per task, but there’s no native portfolio-level KPI builder with flexible formulas.
Project velocity dashboard
Purpose: Track how many tasks your team completes over time
What you can build natively:
- Completed tasks over time (line or bar chart)
- Completed tasks by week
- Task count by assignee
What requires workarounds or external tools:
- Calculate velocity ratios (tasks per sprint, tasks per person)
- Compare current velocity to historical averages
- Set velocity targets and track against them
Workaround: Export data weekly and calculate velocity in a spreadsheet. Or use a reporting tool like BlinkMetrics that calculates metrics automatically from your Asana data.
Resource utilization dashboard
Purpose: Understand how team capacity is being used
What you can build natively:
- Workload view showing allocated hours
- Tasks by assignee
- Incomplete tasks per person
What requires workarounds or external tools:
- Calculate utilization percentage (allocated ÷ available)
- Track utilization trends over time
- Compare utilization across teams
Workaround: Define “available hours” outside Asana and manually calculate utilization. A dedicated reporting tool can automate this by pulling Asana data and applying formulas.
Delivery performance dashboard
Purpose: Track whether work gets done on time
What you can build natively:
- Overdue task count
- Tasks by completion status
- Tasks due this week
- Formula fields that compare due dates to completion dates (per task)
What requires workarounds or external tools:
- Calculate on-time delivery percentage at the portfolio level
- Track late tasks as a trend over time
- Compare delivery rates across projects in a single view
Workaround: Create a formula field that flags whether a task was completed on time, then chart the breakdown. You can also use a “Delivered on Time” dropdown field. This works for individual projects but doesn’t give you a portfolio-wide on-time KPI or historical trends.
Dashboard templates by team type
Quick recommendations based on what works for common team structures:
| Team Type | Must-Have Widgets | Recommended Custom Fields |
|---|---|---|
| Marketing | Tasks by status, completion over time, by assignee | Campaign type, channel, content status |
| Product | Tasks by section, by priority, incomplete count | Priority, story points, sprint |
| Operations | Tasks by due date, overdue count, by category | Department, request type, urgency |
| Agency | Milestones, tasks by client, by deliverable type | Client, deliverable type, billing status |
Creating reusable dashboard configurations
Asana doesn’t offer true dashboard templates, but you can work around this using project duplication.
The project template workaround
Here’s how to create your own reusable dashboard configuration:
- Build a template project — Create a project specifically for use as a template. Set up your ideal dashboard with the widgets you need.
- Add custom fields to your library — Custom fields must be saved to your organization’s field library, otherwise they won’t carry over when you duplicate the project.
- Duplicate when starting new work — Use “Duplicate project” to copy the project structure, including your dashboard configuration.
Limitations of this approach
This workaround helps, but it’s not true template functionality:
- Widget data doesn’t transfer — Charts copy over, but they’ll be empty until tasks populate the new project
- No dashboard-only sharing — You can’t share just the dashboard config; you’re copying the entire project
- Manual updates required — If you improve your template, existing projects don’t inherit those changes
- Single project scope — Each dashboard still only shows data from its own project
For teams managing multiple similar projects (recurring campaigns, client engagements, sprint cycles), this manual approach becomes tedious. You end up maintaining the same dashboard setup across dozens of projects.
When examples aren’t enough: going beyond native Asana dashboards
The examples above show what’s possible within Asana. But if you’re hitting these walls, it may be time to look at dedicated reporting tools:
What you can’t do in Asana:
- Need the same dashboard setup across dozens of projects? Native Asana requires manual recreation each time.
- Want to track how metrics change over weeks or quarters? Asana doesn’t store queryable historical snapshots.
- Need portfolio-wide KPIs with custom formulas? Formula fields work per-task, not across your entire body of work.
- Combining Asana with data from other tools? Native dashboards are Asana-only.
For a full breakdown of what Asana dashboards can and can’t do, see our complete Asana dashboard guide.
What BlinkMetrics adds to Asana reporting
If you’ve hit the ceiling of native dashboards, here’s what becomes possible with a dedicated reporting layer:
- True dashboard templates — You get a done-for-you dashboard that can be filtered by project with a single click
- Cross-project dashboard — Create a single dashboard that pulls from multiple projects, no duplication required
- Historical snapshots — Track how metrics change over weeks, months, or quarters
- Calculated KPIs — Build formulas like on-time delivery rate, utilization percentage, and throughput per person
- Multi-source dashboards — Combine Asana with Stripe, HubSpot, Google Sheets, and 40+ other tools
Ready to build the dashboards Asana can’t?
BlinkMetrics creates unified dashboards from multiple Asana projects with historical tracking, calculated KPIs, and true template functionality.
See a BlinkMetrics Asana dashboard in action →
How to create your own Asana dashboard
Ready to build your first native Asana dashboard? Here’s the quick version:
Step 1: Identify your key metrics
Before touching Asana, write down the 3-5 questions you need your dashboard to answer. For example:
- How much work did we complete this week?
- Who has too much on their plate?
- Are we on track for our deadline?
Step 2: Set up custom fields in your projects
Custom fields power most dashboard visualizations. Common fields to add:
- Status (dropdown: Not started, In progress, Complete)
- Priority (dropdown: Low, Medium, High)
- Category/Type (whatever grouping makes sense for your work)
Add these at the project level, or use the custom field library to share them across projects.
Step 3: Configure dashboard widgets
Open your project’s Dashboard tab and click “Add chart.” Select widgets that answer your key questions:
- Task completion over time for progress tracking
- Tasks by custom field for category breakdowns
- Tasks by assignee for workload visibility
Step 4: Share with stakeholders
Save your dashboard and share the project (View-only access is fine for dashboard viewers). For portfolio-level dashboards, share the portfolio directly.
Related guides
- See our Asana dashboard guide for full step-by-step configuration instructions.
- Asana KPI dashboard — how to track key metrics
- Team empowerment — What can an Asana dashboard empower your team to do?
Frequently asked questions
Not exactly. Asana provides project templates that include pre-configured custom fields and sections, and you can use these as a starting point, but dashboard widgets themselves are not saved as a separate template type. You’ll configure widgets manually based on your project structure.
The workaround: Duplicate a project that already has a configured dashboard. The widget configuration carries over, though the charts will be empty until tasks populate the new project. This works for replicating setups, but it’s not true template functionality. You can’t share dashboard configurations between existing projects or update multiple dashboards from a central template.
For teams that need actual dashboard templates (build once, deploy everywhere), external tools like BlinkMetrics provide clone functionality that Asana lacks natively.
Start with the questions you need answered. If it’s “are we on track?” add a completion over time chart. If it’s “who’s overloaded?” add tasks by assignee. If it’s “what type of work dominates?” add a custom field breakdown. Most dashboards work well with 3-5 focused widgets rather than trying to show everything.
No. Dashboards are part of projects. Viewers need project access (even if View-only) to see the dashboard. For portfolio dashboards, share the portfolio. There’s no way to share a dashboard as a standalone link.