
Advanced Asana reporting for businesses that push Asana to its limits
Juggling lots of custom fields, subtasks, projects, and automation rules? You know some of Asana's frustrating limitations. We fix them.
book a discovery call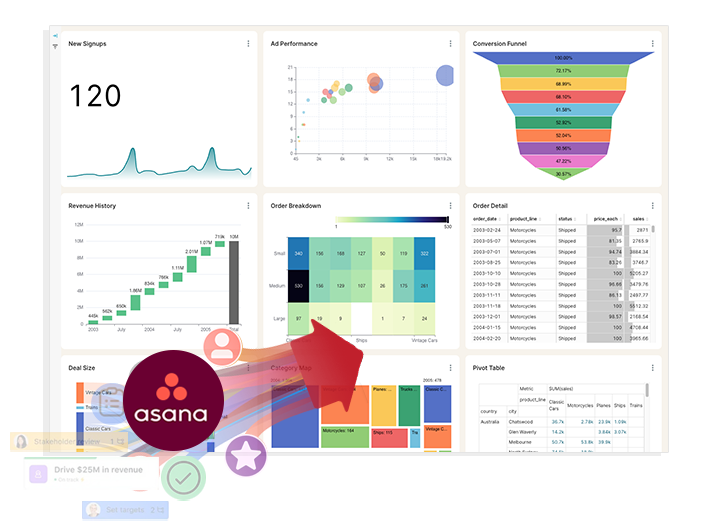
See BlinkMetrics in action
Move beyond Asana's surface-level reports. See how our integration uncovers the hidden insights and operational clarity your business has been missing.
book demo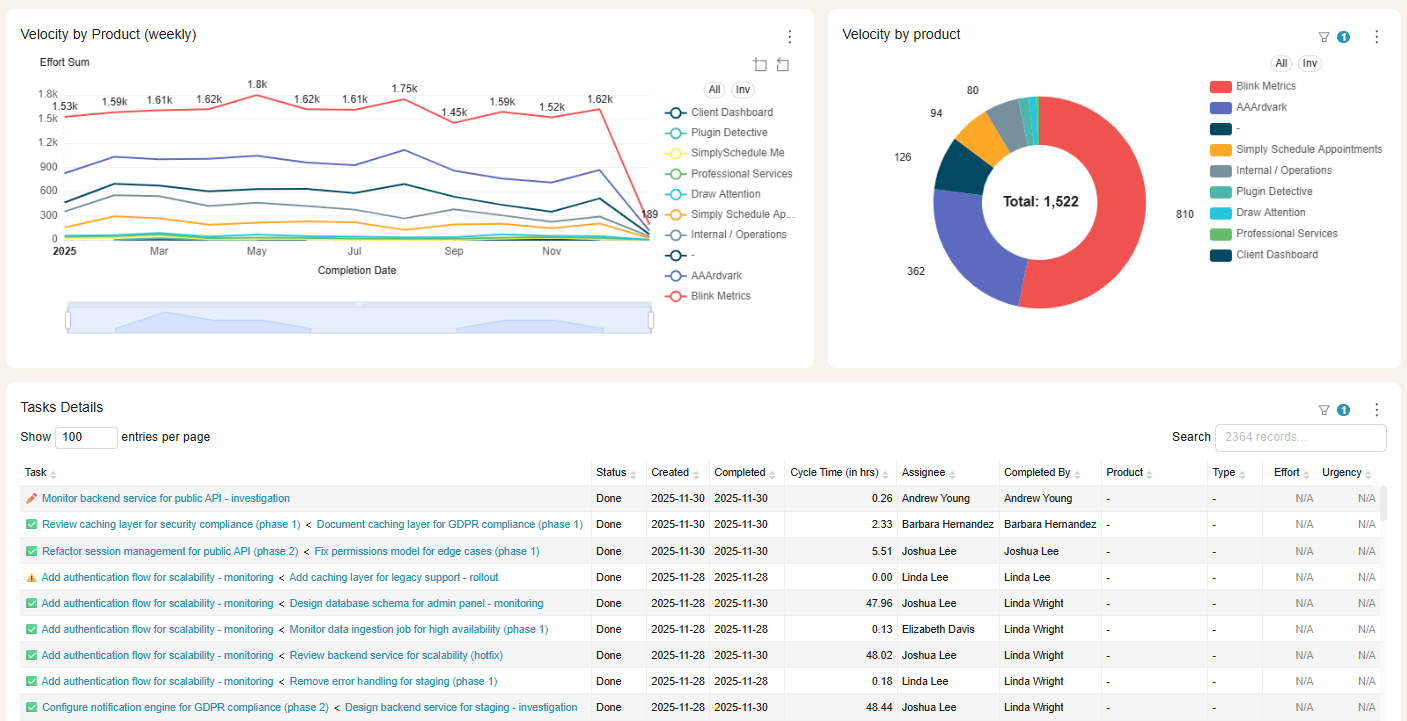
Spreadsheets get you close, but they won't get you all the way
-
Endless CSV Exports
-
Hours to find an answer
-
Broken links, Zaps & formulas
-

Numbers are difficult to verify
-
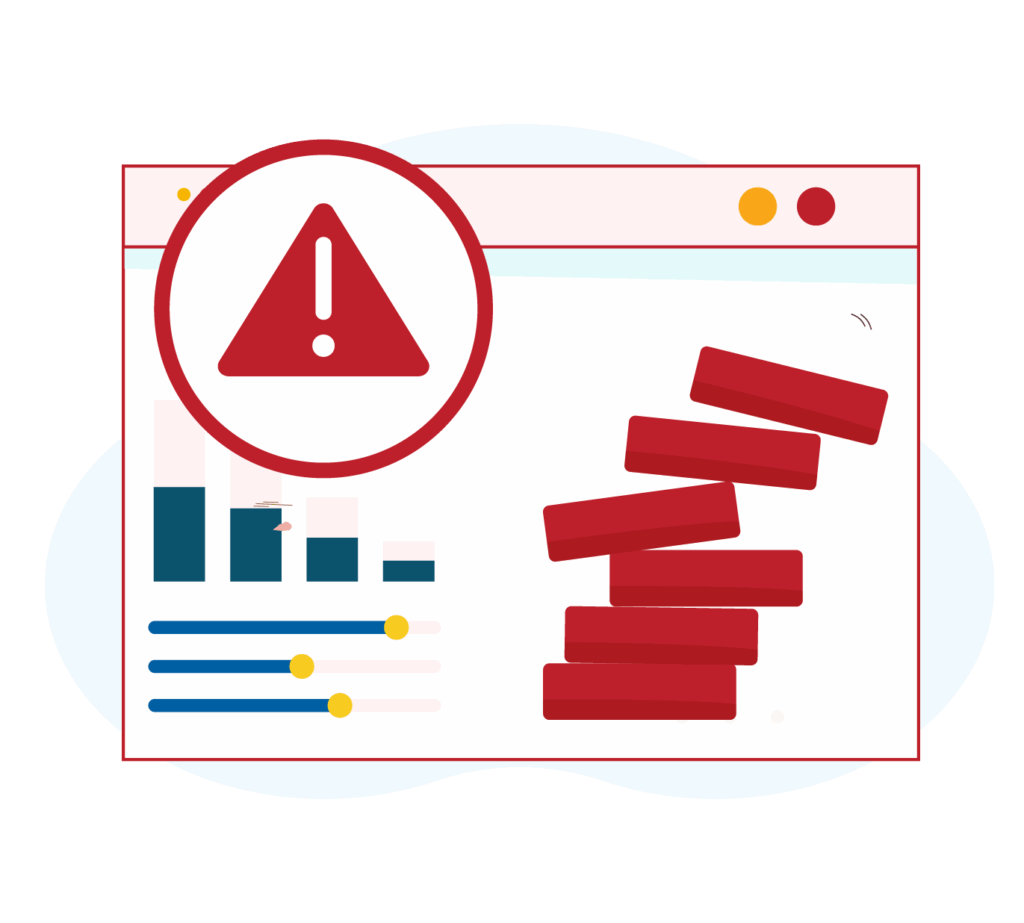
Everything breaking as you scale
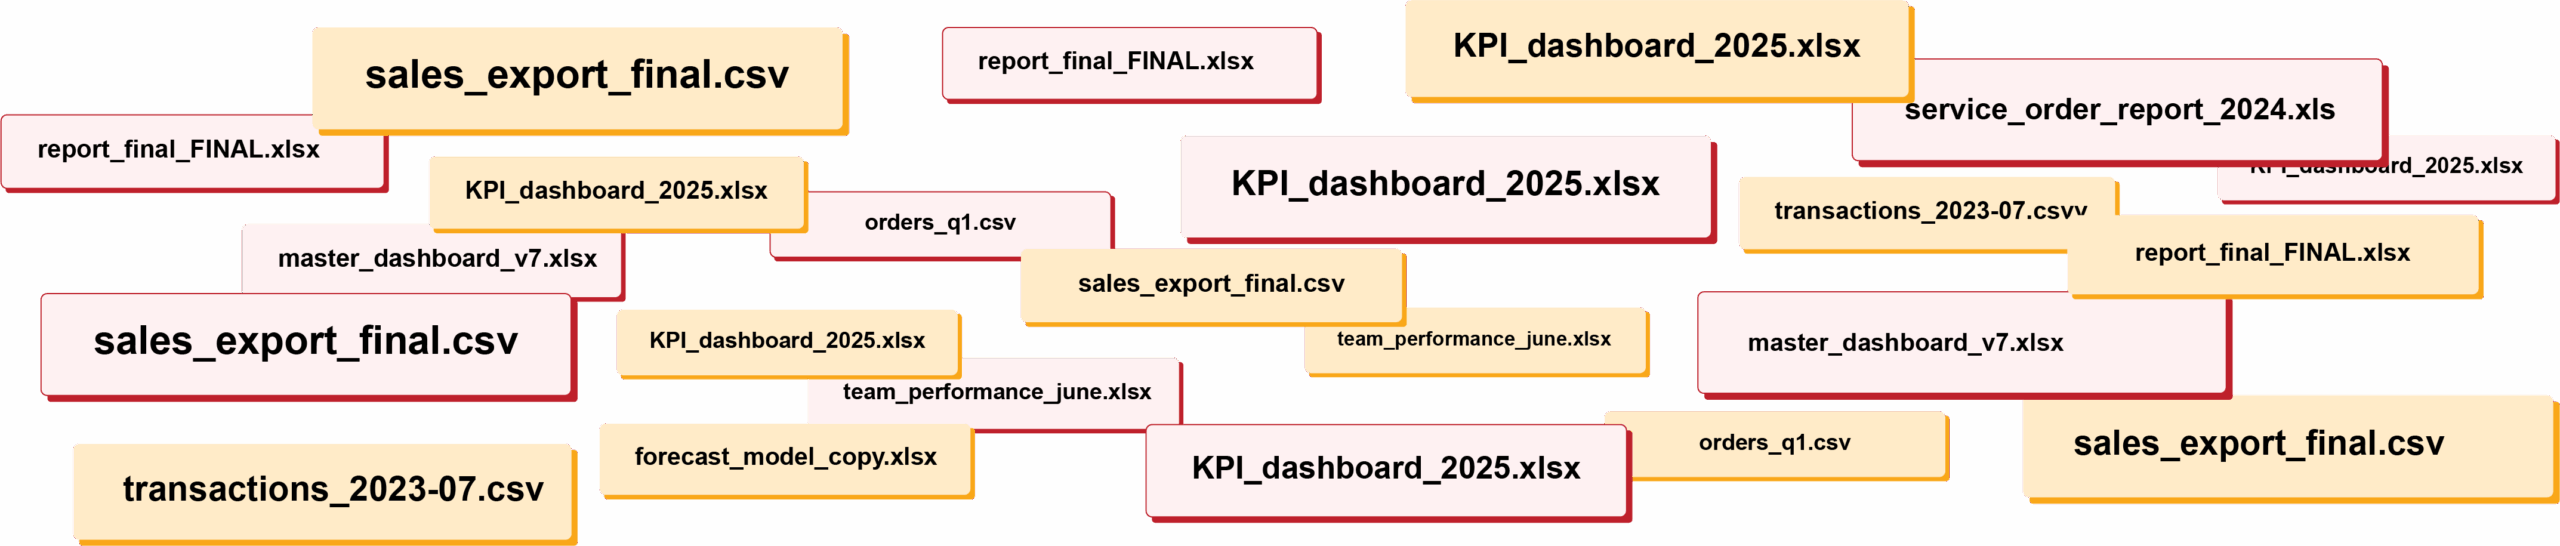
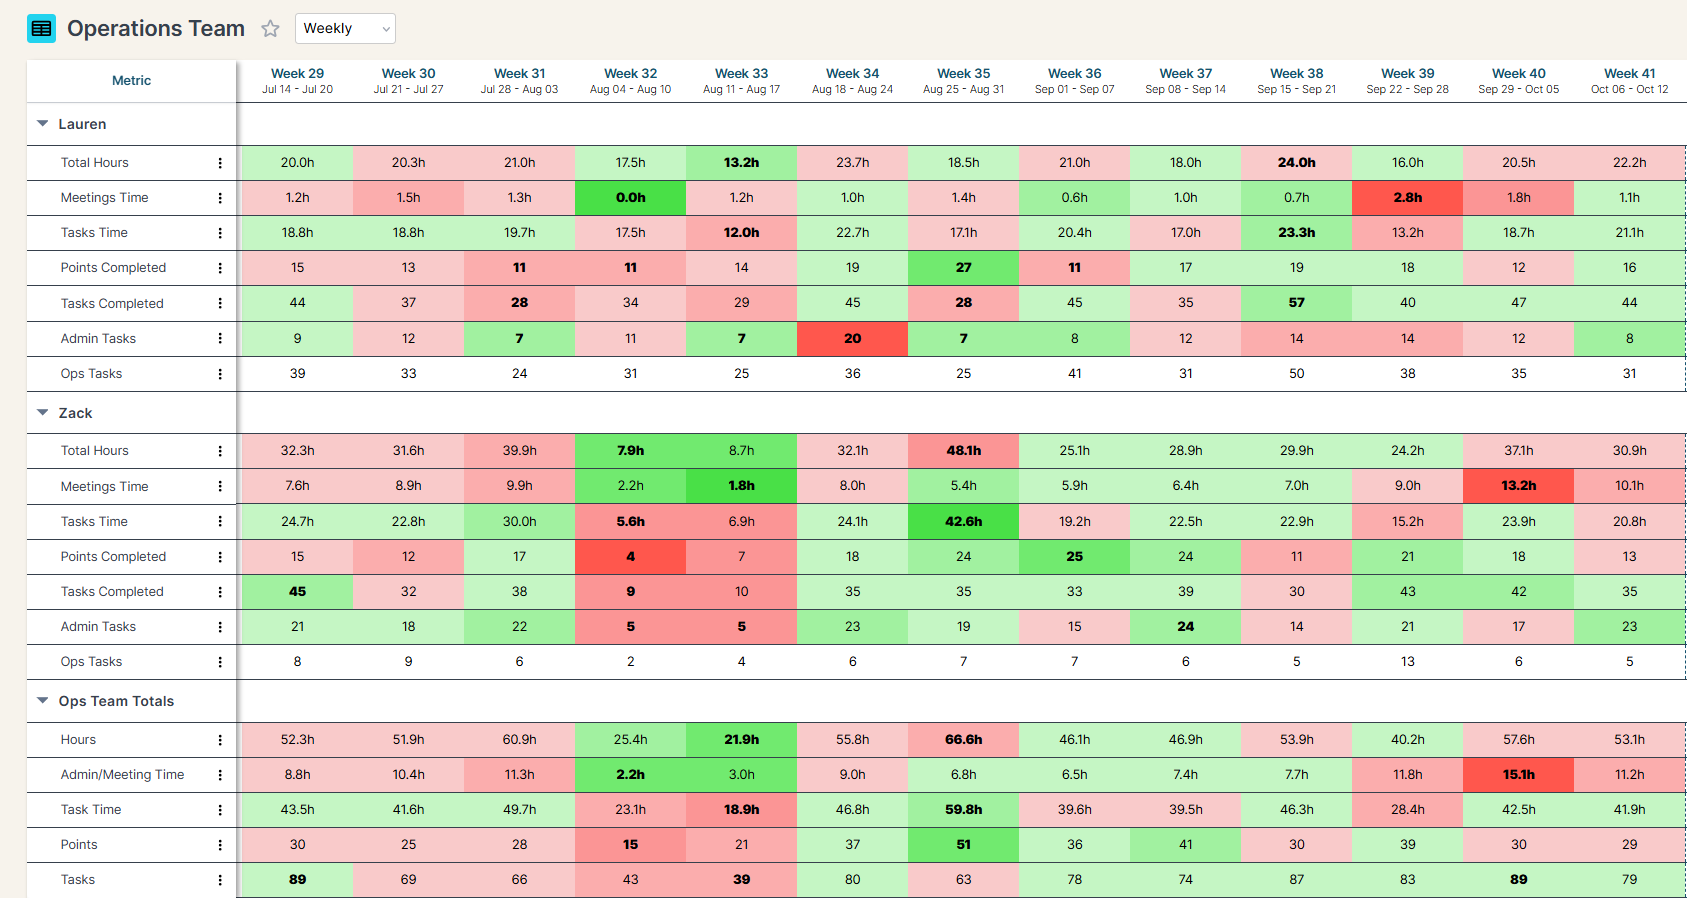
RIP spreadsheets. BlinkMetrics brings your reporting into live dashboards that show what's really happening in your business.
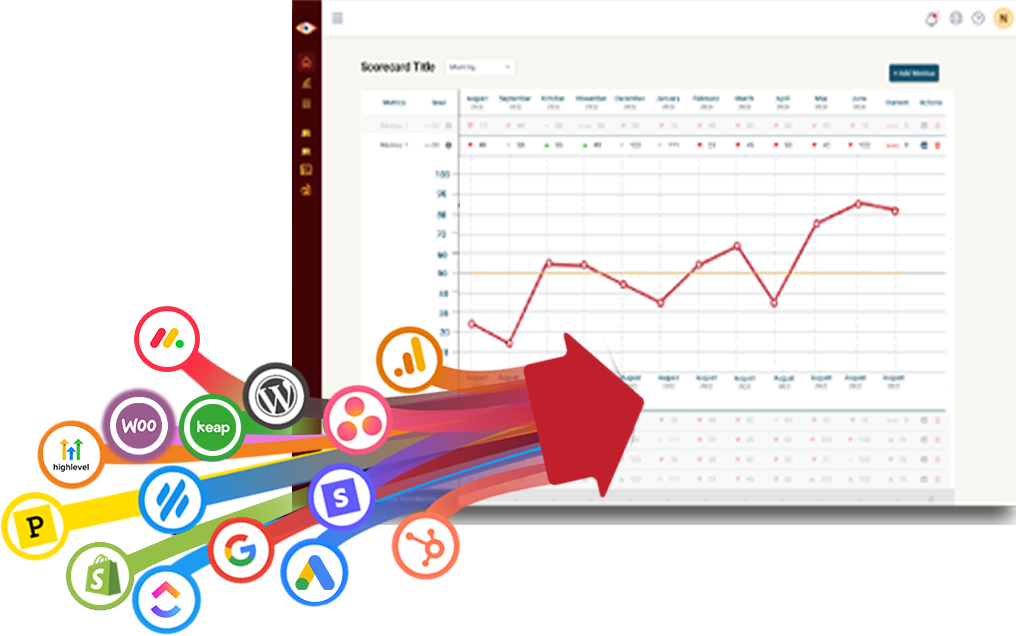
Easily connect to any business tool
We capture raw data from any platform and keep it updated continuously. You'll always have the live numbers, full history, and ability to drill into any KPI for the details that explain it.
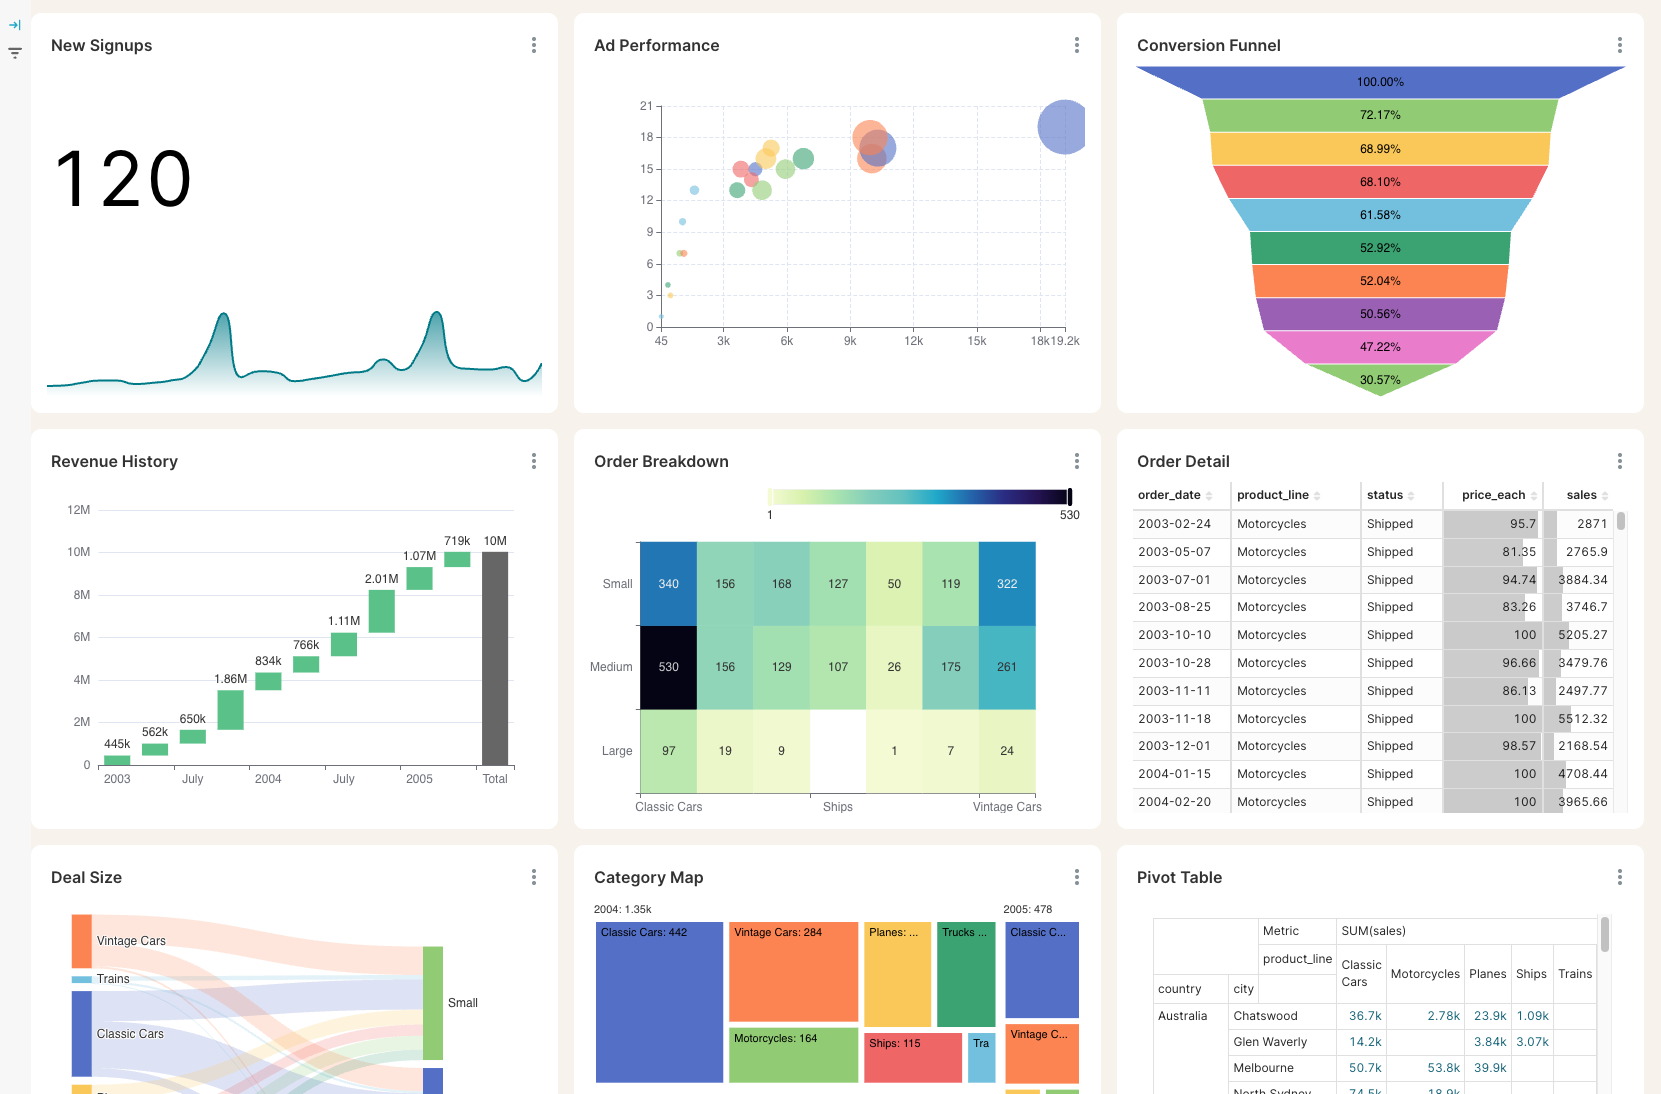
Get the reporting you never could before
Access custom reports with interactive dashboards & scorecards, giving you answers to questions you've never been able to answer easily. Look deeper into any number, explore trends, and slice & dice results by any segment.
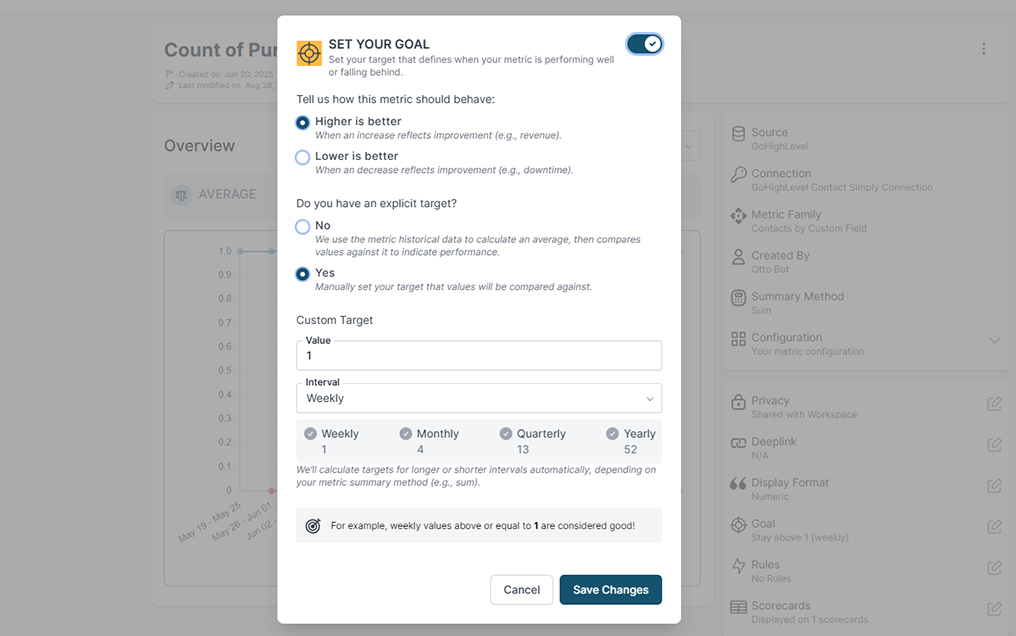
Stay on track with real time visibility & alerts
Set clear goals, track progress in real time, and get alerts the moment a KPI slips or beats target. Acting proactively & not reactively means you're no longer the last to know.
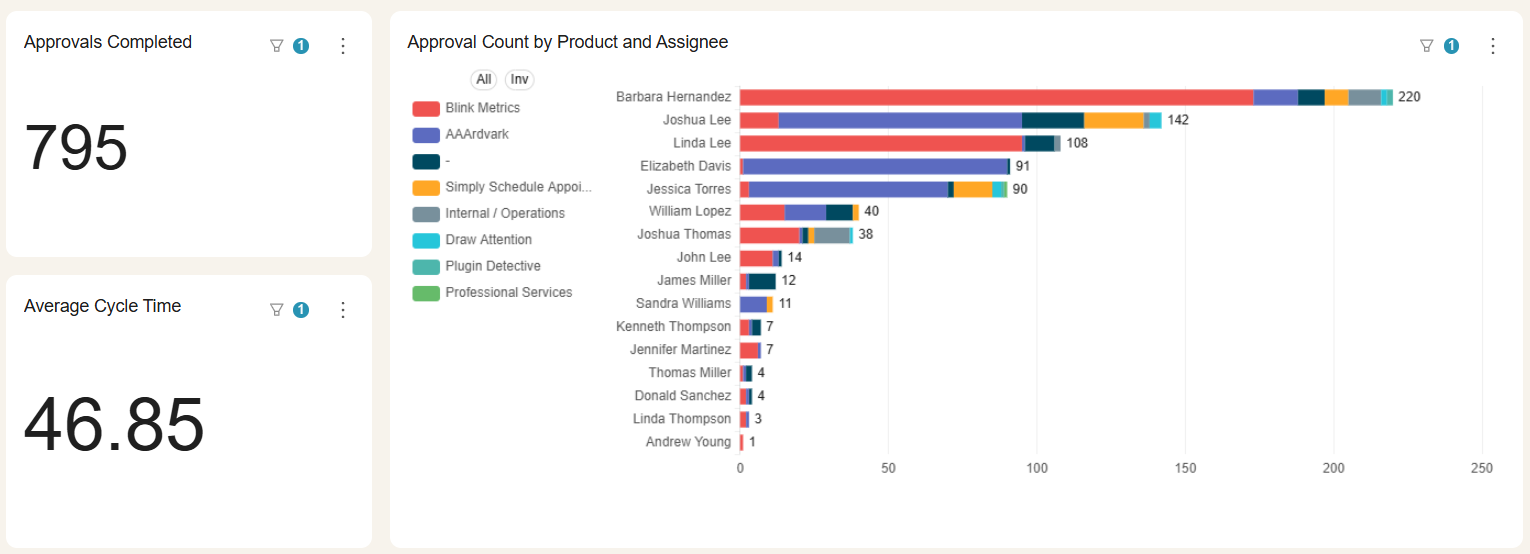
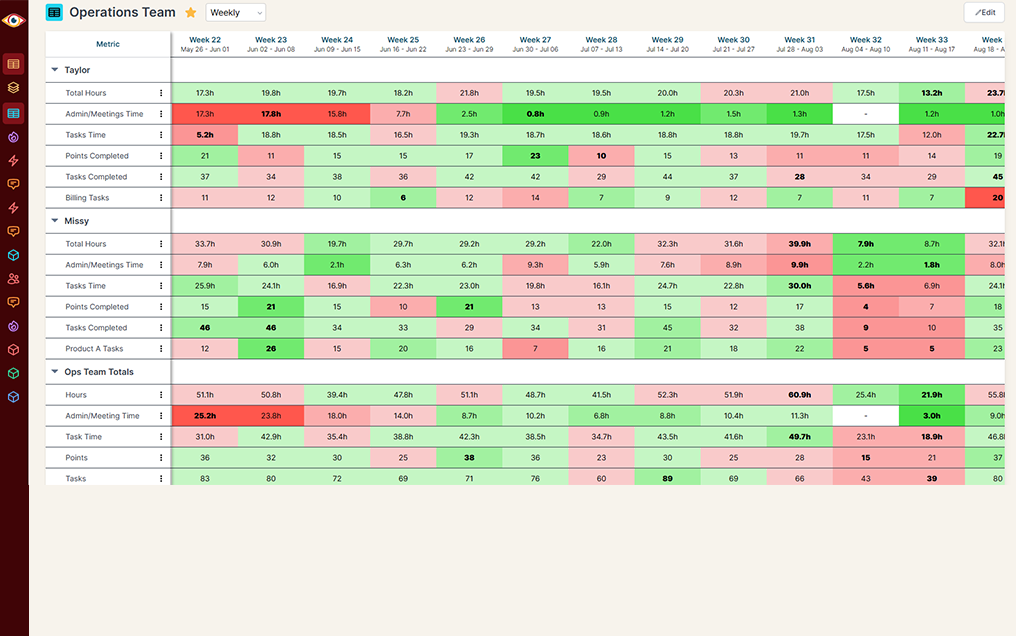
Keep your team in the loop and accountable
Keep goals front and center with reports designed for each person, team, or location — shared in real time to keep performance transparent and encourage accountability.
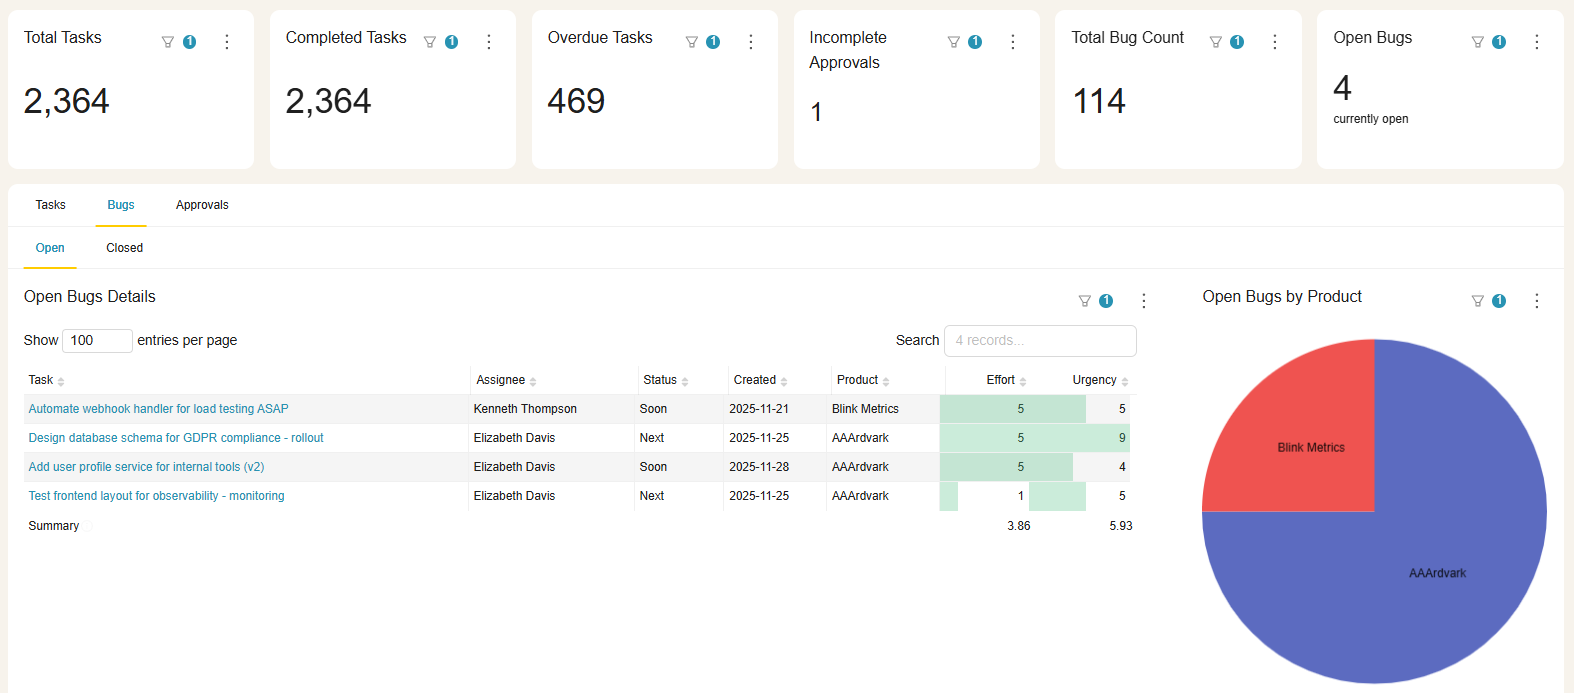
Do you have questions that are difficult or impossible to answer with Asana's built-in reporting?
BlinkMetrics gives you instant visibility into every corner of your Asana workspace.
Asana alone
Historical Reporting & Trend Analysis
Custom Filtering & Data Segmentation
Reporting Depth
Cross-Project Dashboards
Multi-Source Dashboards
Global Filters
Dashboard Design
Calculated Metrics, KPIs, & Formulas
Planned vs. actual (budget / effort)
Asana + BlinkMetrics
Historical Reporting & Trend Analysis
Custom Filtering & Data Segmentation
Reporting Depth
Cross-Project Dashboards
Multi-Source Dashboards
Global Filters
Dashboard Design
Calculated Metrics, KPIs, & Formulas
Planned vs. actual (budget / effort)
Beyond reporting
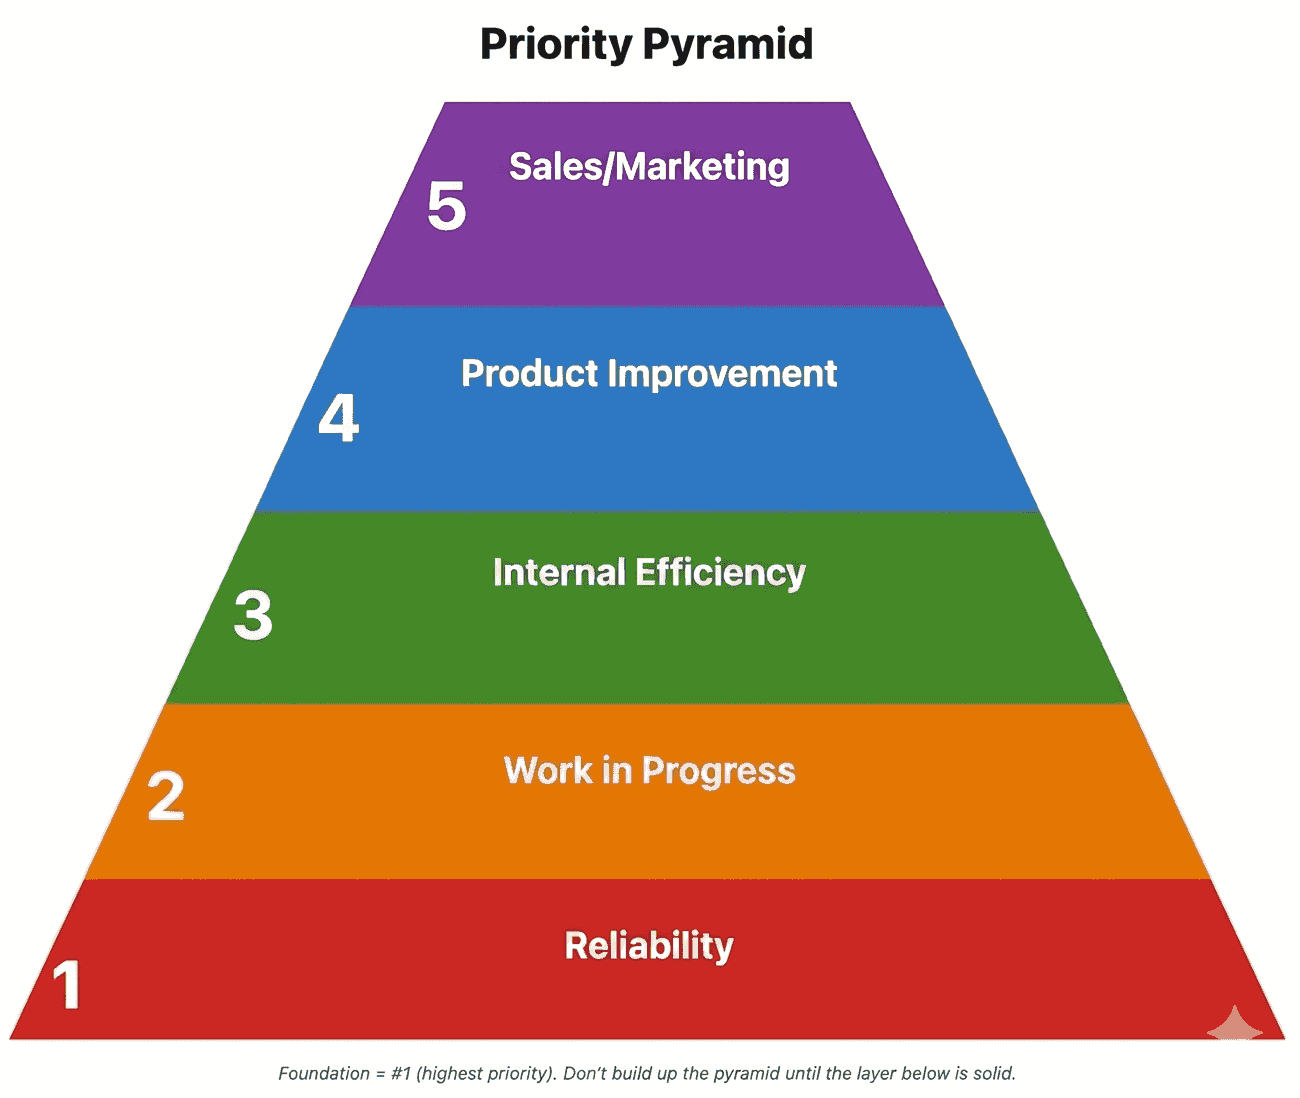
Prioritization shouldn't be a guess. Or a standup argument.
The reporting you rely on, now with the automation to act on it. Your dashboards show what's happening. This decides what your team does next. We configure a prioritization engine inside Asana that scores every task on a transparent, weighted formula using factors of your choice, like due-date pressure, blockers, strategic focus, and who's waiting, then writes a live priority number to each one, refreshed daily. No more subjective High/Medium/Low, where the loudest voice wins. Just one objective ranking you can sort any view by, so the most important work rises on its own. We build it, document it, and tune it with you as priorities shift.
Complete visibility in 30 days — we'll build you the ultimate Asana reporting dashboard
Easily see what's difficult or impossible to see in Asana
Have questions about what's possible or how this works?
These are the questions we get most frequently, but we'd love to talk with you on a quick call.
-
Do you handle the setup, or will my team need to do it?
Your BlinkMetrics dashboard is fully done-for-you. No coding or developers are required. You just tell us what you want and our team builds it.
-
How long does it take to get my BlinkMetrics + Asana dashboard live?
Setup is quick and simple. Connecting your Asana account and other data sources takes just a few minutes. Our team will deliver your custom dashboard in 30-days or less.
-
What happens during a BlinkMetrics + Asana demo?
Meet with our founder, Nathan, to walk through a live BlinkMetrics Asana dashboard and visualize what deeper Asana reporting could look like for you.
-
What will I see in BlinkMetrics that I can't get from native Asana reporting?
Native Asana reporting is great for quick snapshots, but it struggles with history, cross-project trends, and deeper workload or performance analysis. With BlinkMetrics, you can see how your Asana data changes over time, compare projects and teams in one place, and drill into the “why” behind bottlenecks, slippage, and capacity issues.
-
Can BlinkMetrics create custom dashboards or views for different teams and departments?
Yes. We can build focused dashboards for different audiences—operations, leadership, client services, specific departments—using the same underlying Asana data. Each group can get its own views, filters, and KPIs without duplicating work, so people only see what’s relevant to them while you maintain a single source of truth.
-
How does BlinkMetrics handle historical Asana reporting?
BlinkMetrics takes regular snapshots of your Asana environment and stores them in a dedicated analytics layer. That means you can rewind to see what portfolios, projects, workloads, and key metrics looked like at any point in time, compare periods (like this quarter vs. last), and track trends without manually archiving or exporting data.
-
Can BlinkMetrics help us prioritize the work, not just report on it?
Yes. Beyond dashboards, we can configure an automatic prioritization engine inside your Asana. It scores every task on a transparent, weighted formula that weighs due-date pressure, blockers, strategic focus areas, and who's waiting on it, then writes a live priority score to each task that refreshes daily. Your team sorts any list, board, or portfolio by it and always knows what to work next.
-
How is the priority score calculated, and is it a black box?
No. It's a deterministic formula built from signals you choose and weight. Every score is explainable down to the points, we document it for your team, and we re-tune the weights as your priorities shift each quarter.
-
Will this disrupt how my team already uses Asana?
No. It runs quietly in the background and simply adds a priority score to the tasks you already have. Nobody changes how they work. They just get a consistent, reliable ranking to sort by. We handle the setup, configuration, and ongoing support.

Ready for the ultimate Asana reporting dashboard?
We've used Asana since 2010 (yes, really). We have a ton of data in Asana, we have found many reporting gaps, and we have filled them all.
book a call to see what's possible