As PMOs, agency owners, or operations leaders, we need to be able to answer “how are all my projects doing?” (ideally without opening each one individually). Asana’s portfolio features promise this visibility, but how much reporting power do you actually get?
What Asana portfolio reporting includes
Asana does have native portfolio reporting options for Asana Advanced, Enterprise, and Enterprise+ tiers, as well as legacy tiers Business and Legacy Enterprise.
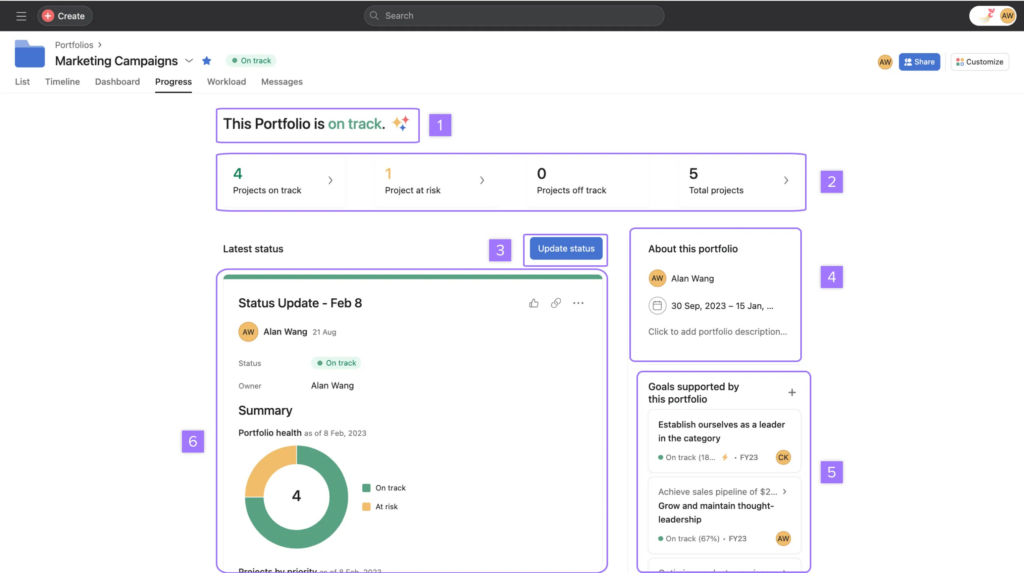
Portfolio Views:
- Progress tab – Project health rollups (on track, at risk, off track) with owner updates
- Workload tab – Team capacity across all portfolio projects
- Timeline tab – Gantt-style view of project dates
Universal Reporting:
- Charts that pull data from multiple projects in one view
- Filter by portfolio, team, or custom fields
Goals:
- Link portfolios to company objectives
- Progress rollups from linked projects
For step-by-step setup, see our Asana dashboard guide.
Portfolio-specific gaps
When you need actual portfolio analytics, Asana’s native tools fall short:
- No portfolio KPI scorecards: Status tab shows health; Universal Reporting shows charts. But there’s no single view with calculated portfolio metrics (on-time delivery rate across all projects, aggregate utilization, etc.)
- No portfolio history: You see current project health, not “how has portfolio health trended over the quarter?”
- No cross-project calculated metrics: Formula fields work per-task, not across multiple projects. You can’t natively calculate “average completion rate across my 20 client projects.”
- Limited portfolio-level custom fields: Portfolios support custom fields, but they’re limited (up to 100 per portfolio) and share the same global field system used elsewhere. You may hit governance and scale limits when modeling rich portfolio metadata.
Universal Reporting as a portfolio solution
Universal Reporting is Asana’s answer to “I need data from multiple projects.” It helps, but has limits:
- ❌ You can group charts on a dashboard, but there’s no native KPI scorecard with calculated metrics
- ✅ Create charts pulling from all projects in a portfolio
- ✅ Filter by team, status, custom fields
- ❌ Only basic aggregations (counts, sums); no custom formulas or complex ratios
- ❌ No historical snapshots (shows current state only)
If Universal Reporting meets your needs, you’re set. If not, you’ll need external tools.
Better alternative for Asana portfolio reporting
If you’re asking these questions, you’ve outgrown native portfolio reporting:

- “What was our on-time delivery rate across all projects last quarter?”
- “How has portfolio health changed over time?”
- “Can I combine Asana project data with budget or time tracking data?”
BlinkMetrics builds the cross-project dashboards, historical snapshots, and calculated KPIs that Asana portfolios can’t.
Get real portfolio reporting
Asana’s portfolio views show status. BlinkMetrics shows metrics: calculated KPIs across all your projects, historical trends, and portfolio health over time.