
 * Not Customer's Actual Data *
BlinkMetrics® success story
How Kids2Dentist turned QuickBooks data into founder-friendly financial storytelling
“My mind works in the QuickBooks P&L. I can very clearly see the story, but I realize other people can't.”
— Joia Doss, Fractional COO, Kids2Dentist
Kids2Dentist is a dental service organization (DSO) with four active dental practices across California's Central Valley and a fifth on the way. All of the company's financial data lives in QuickBooks Online, but standard P&L reports weren't giving the leadership team what they needed — a clear, visual picture of how each office and business line was performing.
BlinkMetrics delivered automated visual financial dashboards that sync daily with QuickBooks, providing three distinct reporting views covering trends over time, office-by-office detail, and year-over-year comparisons. No manual data entry, no monthly update process, no per-seat licensing.

Meet Kids2Dentist
Kids2Dentist operates dental practices in Visalia, Fresno, Delano, and Porterville, California with another location coming online soon. The company runs multiple business lines (oral surgery, general anesthesia, clinic, and orthodontics) across all locations, each tracked as a separate class in QuickBooks Online.
Joia Doss manages the financial and operational side of Kids2Dentist. The founder, now stepping back from the day-to-day, is focused on growth — bringing in practice partners and scaling the organization into a corporate structure. That growth created an urgent need for clean, visual financial reporting that the entire leadership team and new practice partners could understand and use.

Joia Lanier Doss
Fractional COO, Kids2Dentist
The Kids2Dentist team's challenge
Kids2Dentist had all the data they needed sitting in QuickBooks — P&L statements, expense breakdowns by office, revenue by business line. Joia could read the numbers and see the story, but the rest of the leadership team thinks visually. They needed a way to look at the business that didn't require a finance background.
"We just need something that someone who doesn't understand financial statements can view to understand how the business is moving," Joia explained. As the company grew and began bringing in practice partners, the stakes went up. "We're bringing in partners into these practices. And so we need to be able to very clearly and cleanly review financials with them."
On top of that, Joia's team is small. She used to build financial reports herself in previous consulting roles, but that wasn't a viable option this time.
As Joia put it:
“I used to build a lot of dashboards myself, but I just didn't have the hands or time right now. There's really nobody else on our team that would know how to even input data to refresh graphics.”
— Joia Doss, Fractional COO
Alternatives considered
- Power BI: $15–$25/user/month, 3-seat minimum, ~$200/month hosting
- Self-hosted Open Source (Superset): ~$100/month hosting plus self-build dashboard
- Manual builds: static PowerPoint or Excel, monthly updates required
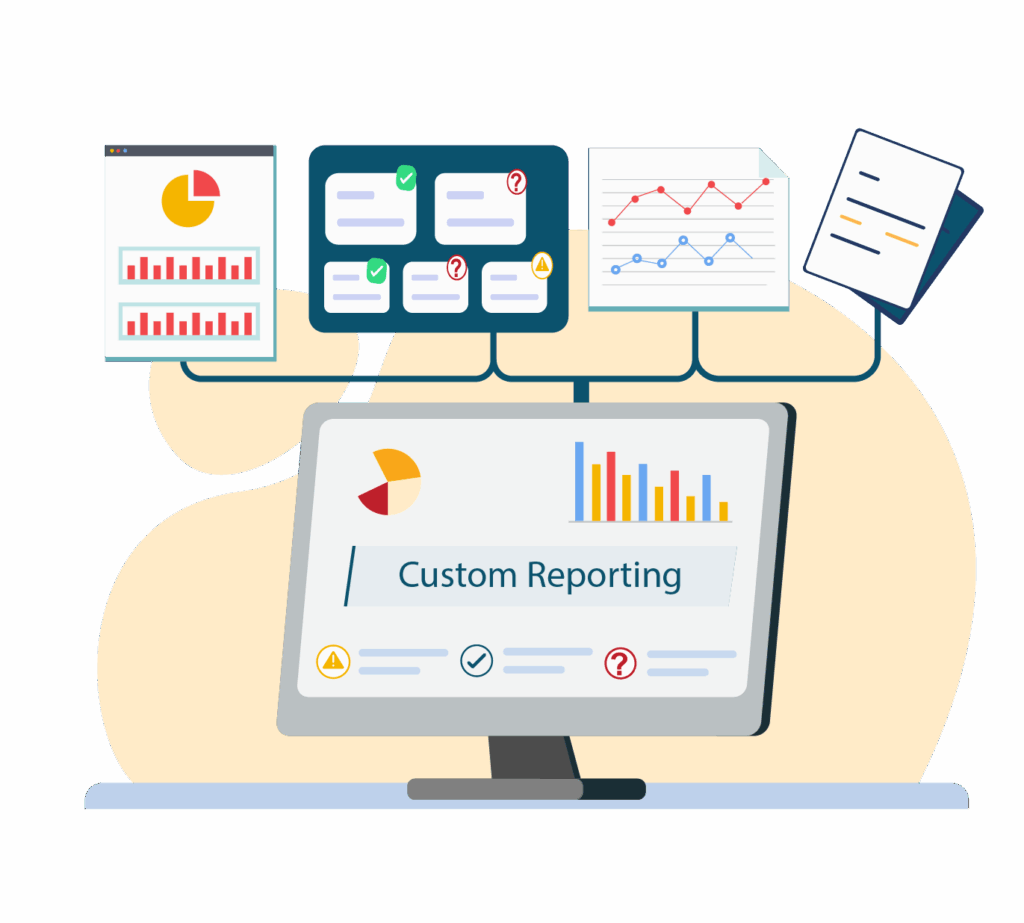
The Solution
Custom Dashboards Built for Action
BlinkMetrics connected directly to Kids2Dentist's QuickBooks Online account using a pre-built connector, pulled the data into a dedicated data warehouse, and built a set of automated visual dashboards covering the full financial picture. Joia and the Kids2Dentist team didn't have to do any of the building, hosting, maintaining, or updating.
With their new custom dashboards, Joia and the Kids2Dentist team received:
Automated daily QuickBooks sync
A data pipeline pulls P&L data, office classes, and a chart of accounts from QuickBooks every day. All dashboards are configured to reflect data that matches what the team sees in QuickBooks.

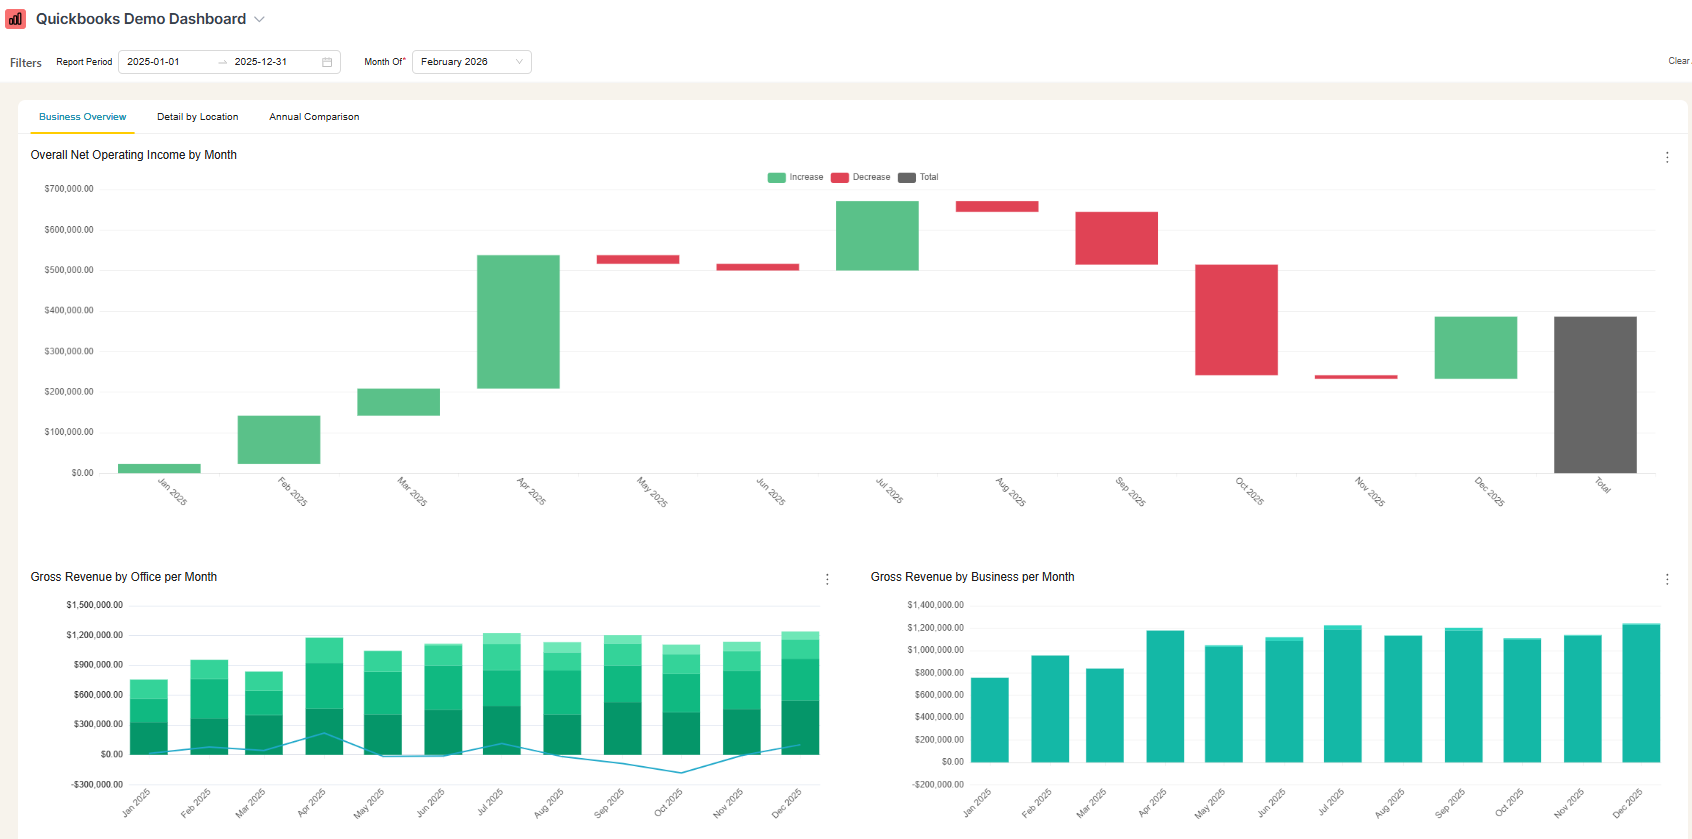
Business Trends dashboard
Visualizes data from all offices combined over time with filters to drill into individual locations. The view includes revenue by business line, revenue by office, operating expenses versus gross revenue, and net operating income by month. Leadership gets a clear read on the direction of the business.
Detail dashboard
Provides an office-by-office comparison over any time period. Charts include gross revenue, operating income, expenses, and expense-to-revenue percentages for each office side-by-side, so the team can quickly see which offices are running lean and which need attention.

Comparison dashboard
Year-over-year performance by office is critical to see relative performance patterns. The year-over-year comparison charts make it easy to see revenue and expenses this year vs last, broken out by location and business line, so the team can track growth across the organization and spot any anomalies.
How we built a solution together
A three-stage journey to data-driven decisions
- Stage 1
Discovery
Identified Kids2Dentist's reporting needs, QuickBooks class structure, and the specific questions leadership and practice partners needed answered.
- Stage 2
Development
Built custom dashboards for business trends, office-by-office detail, and year-over-year comparison — all fed from the QuickBooks data pipeline.
- Stage 3
Implementation
Synced live QuickBooks data, refined dashboards with Joia's feedback, and handed over a system that updates itself every day.
I was worried I was going to have to do it myself. So, having you build us a custom reporting dashboard is perfect, and it'll auto-update!

Joia Doss
Fractional COO, Kids2Dentist
Turning data into efficiency, profit, and a scalable future
The Kids2Dentist transformation

Visual reporting for the whole leadership team
Financial data that used to live in spreadsheets or QuickBooks exports only Joia could interpret is now accessible to the founder, practice partners, and office-level staff through clean, visual dashboards. The data tells the story on its own.

Zero manual reporting labor
The daily auto-sync from QuickBooks eliminated the monthly burden of pulling, formatting, and presenting financial data. "That's best for us because it eliminates the labor issue of pulling it every month or quarter," Joia said when she learned the dashboards would update themselves.

Partner-ready financial visibility
As Kids2Dentist brings in new practice partners, the Detail dashboard provides the kind of clean, office-level financial view that partners expect, without Joia having to build a custom presentation each time.
Built to grow
The BlinkMetrics dashboard supports unlimited users and offices. Kids2Dentist has a solid foundation to scale up their operations. As they open additional offices and bring on new partners, they have a system that can grow with them.
What Joia says about working with BlinkMetrics
It helps that you actually understand a P&L because a lot of people are making graphs, but if you can't read a financial statement, then it's going to be hard for you to get the storytelling portion of it.
Joia Doss
Fractional COO, Kids2Dentist

Why Work with BlinkMetrics?
More Than Dashboards: A Partnership for Growth
Financial literacy built in:
BlinkMetrics doesn't just make graphs. The team understands P&Ls, operating income, expense rates, and cash flow reporting. That financial fluency shows up in dashboards that tell a story.
Automation that replaces labor:
With a daily QuickBooks sync, there's no monthly export, no manual data entry, no dependency on one person to keep reports current. The data is always fresh.
Right-sized for growing businesses:
A 30-day build and a low ongoing monthly cost with unlimited users means Kids2Dentist gets the reporting depth of enterprise BI without the enterprise price tag or extended implementation timeline.
A trusted partner for the long term:
We don't just deliver a dashboard and disappear. As Kids2Dentist adds locations, brings on partners, and restructures their QuickBooks setup, the BlinkMetrics fractional data team will ensure their reporting grows with them.

Let's build the foundation for your next stage of growth
Ready to turn your QuickBooks data into a story your team can read?
Whether you need to align leadership around financial performance, prepare for business growth, or just stop spending hours on monthly reporting, BlinkMetrics can help.
Talk to our team