
Advanced Help Scout reporting that answers your most pressing customer support questions
Stuck exporting CSVs, switching tabs, and explaining support trends with limited data? You know Help Scout's reporting gaps. We fill them.
book a discovery call
See BlinkMetrics in action
Go beyond Help Scout's generic reports. See how our integration ties every conversation to revenue, surfaces a true customer 360, and exposes the support ROI your team has been missing.
book demo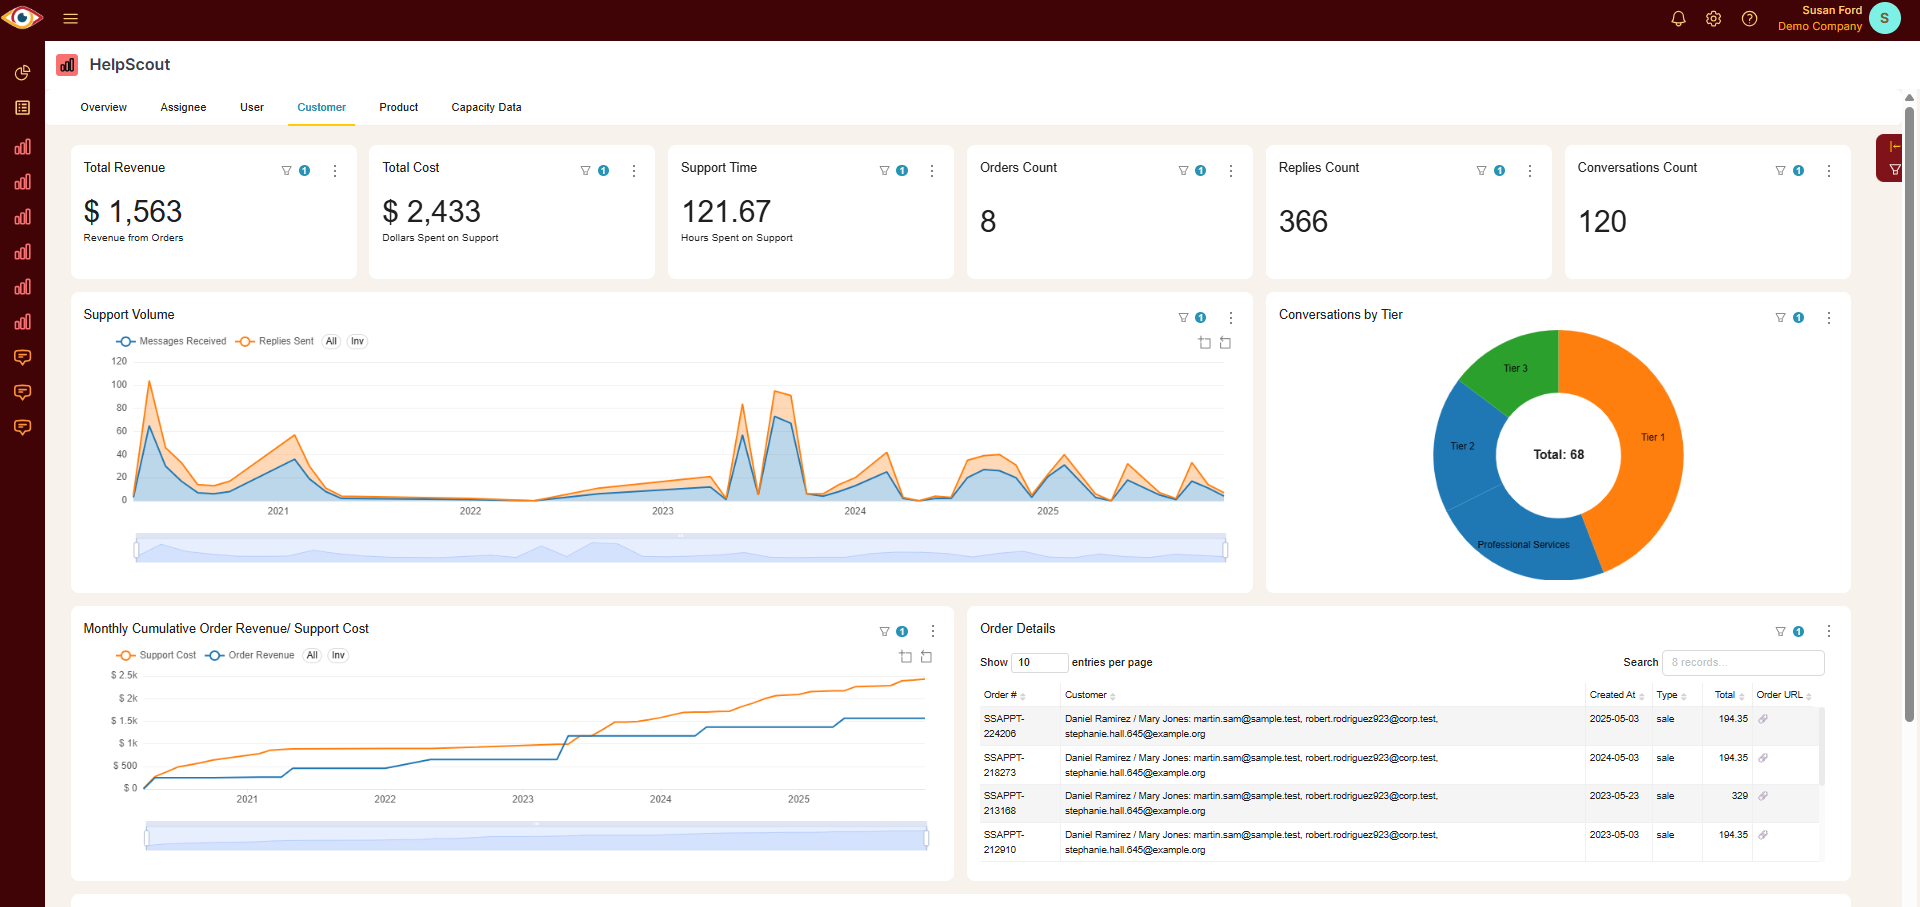
Spreadsheets get you close, but they won't get you all the way
-
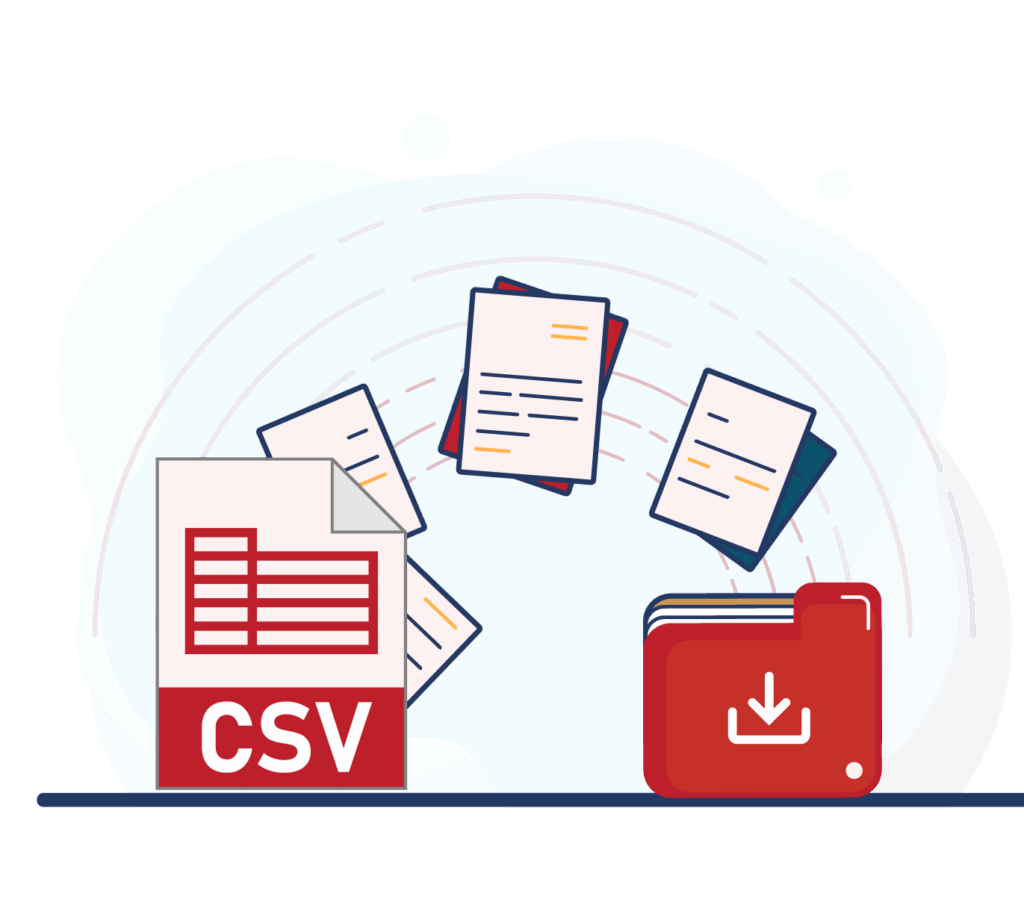
Endless CSV Exports
-
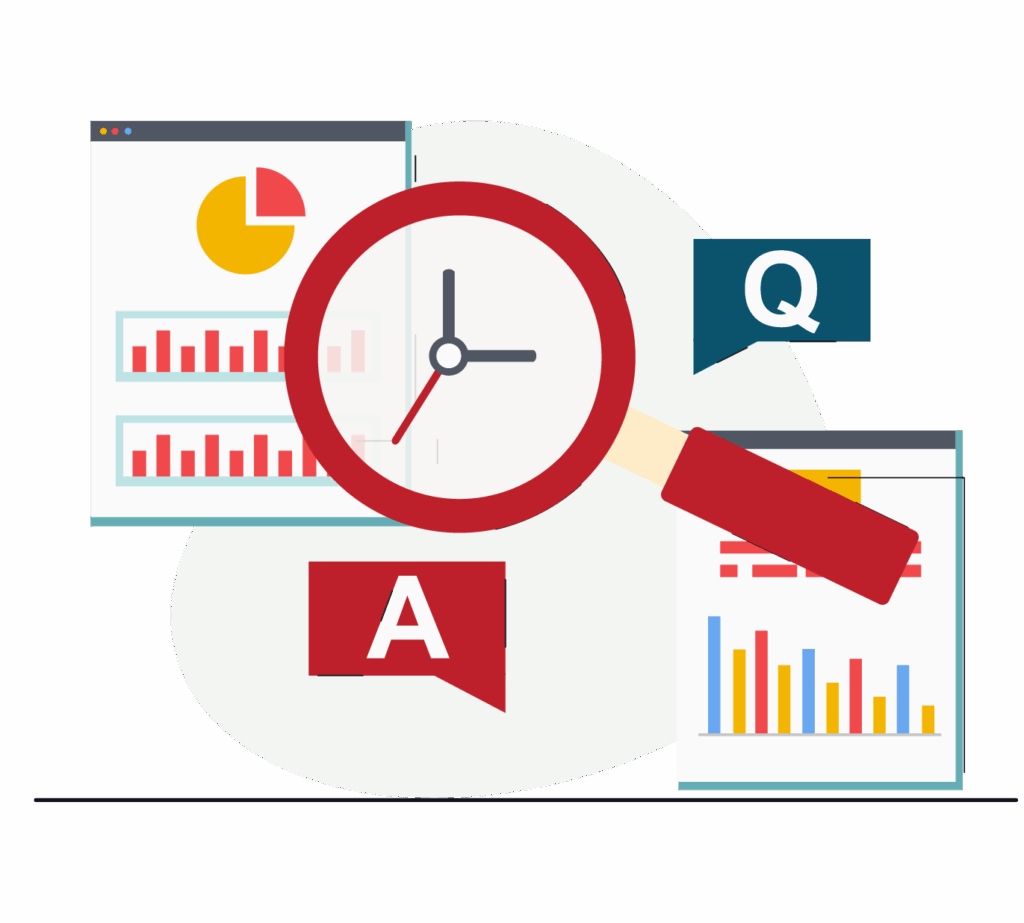
Hours to find an answer
-
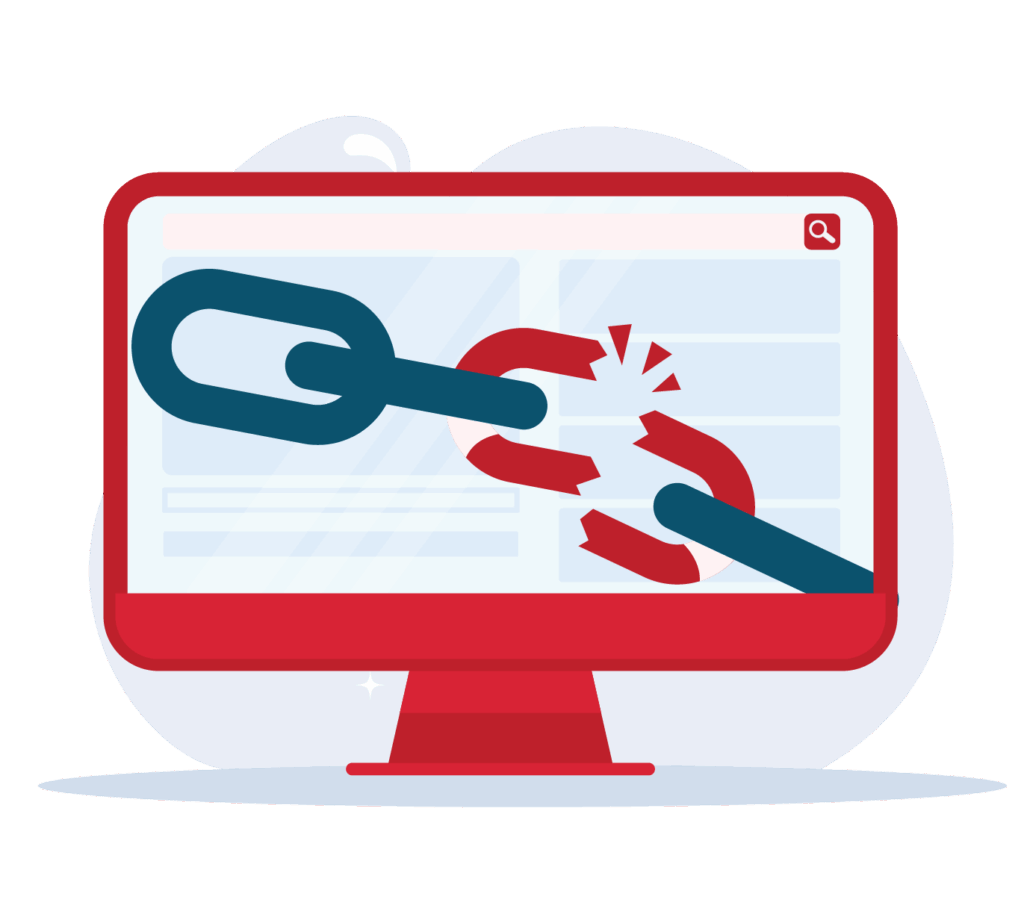
Broken links, Zaps & formulas
-

Numbers are difficult to verify
-
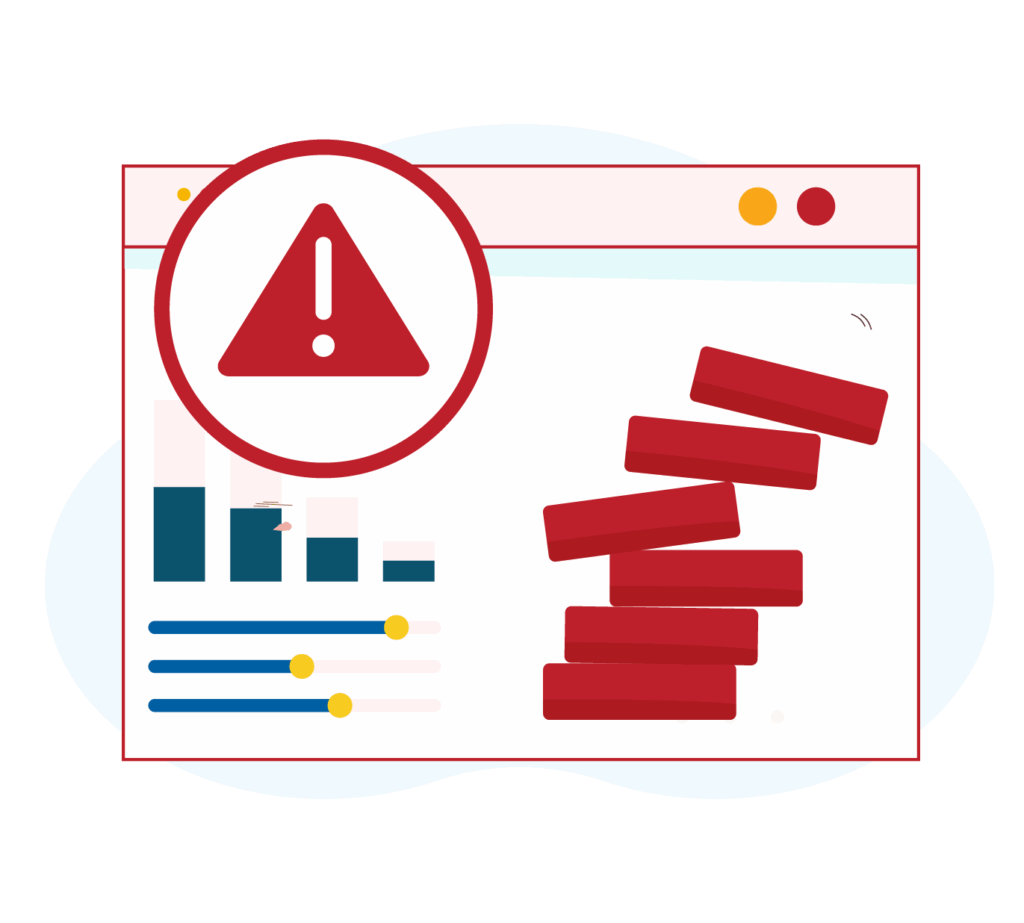
Everything breaking as you scale
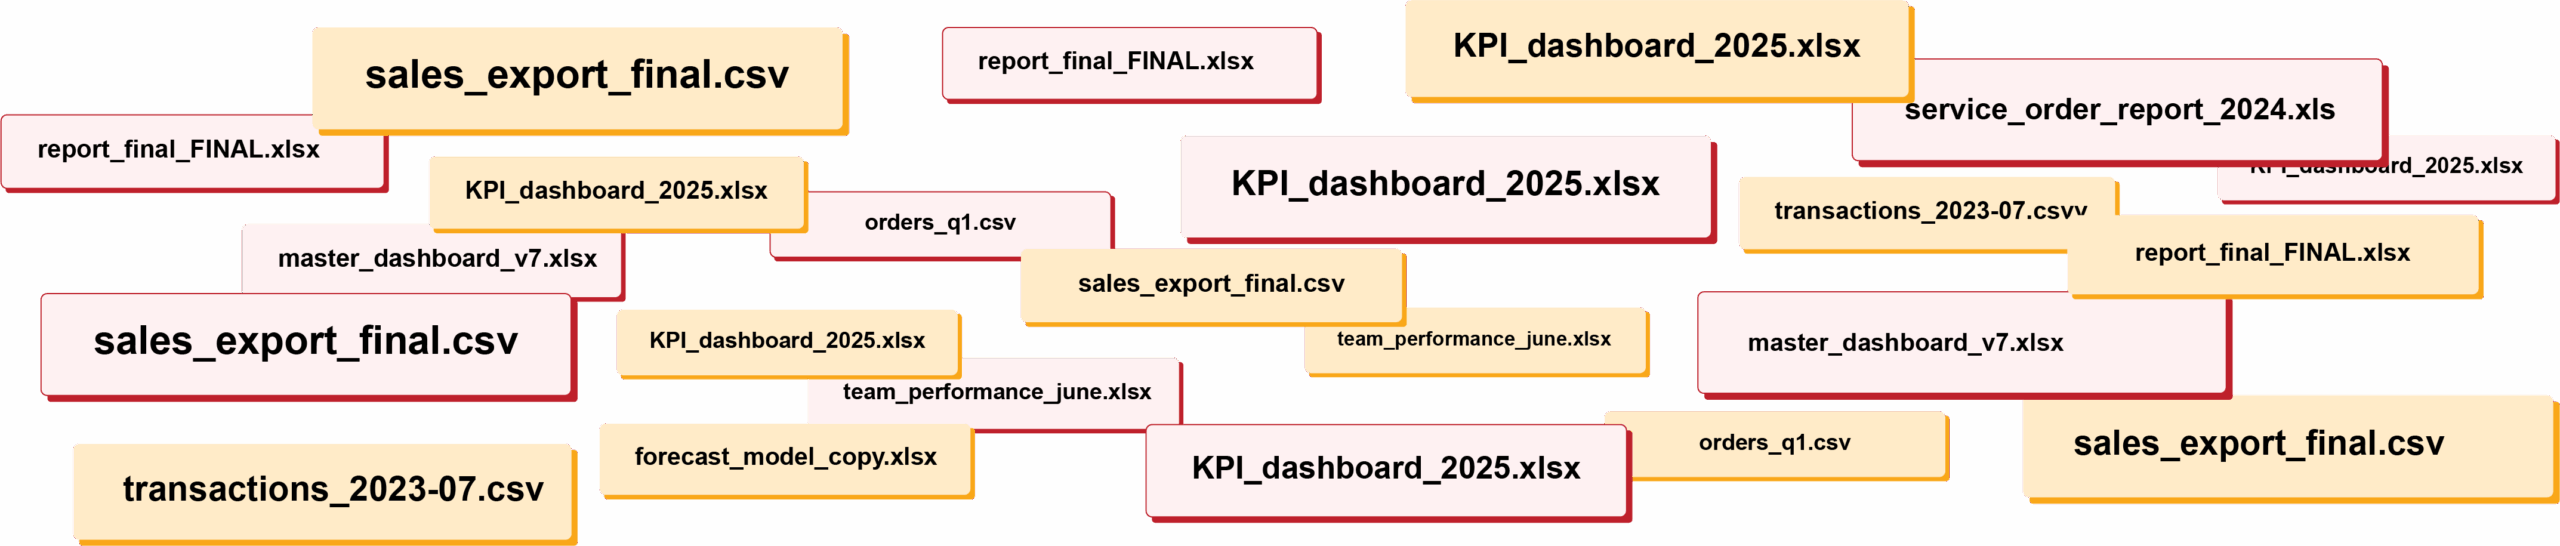
RIP spreadsheets. BlinkMetrics brings your reporting into live dashboards that show what's really happening in your business.
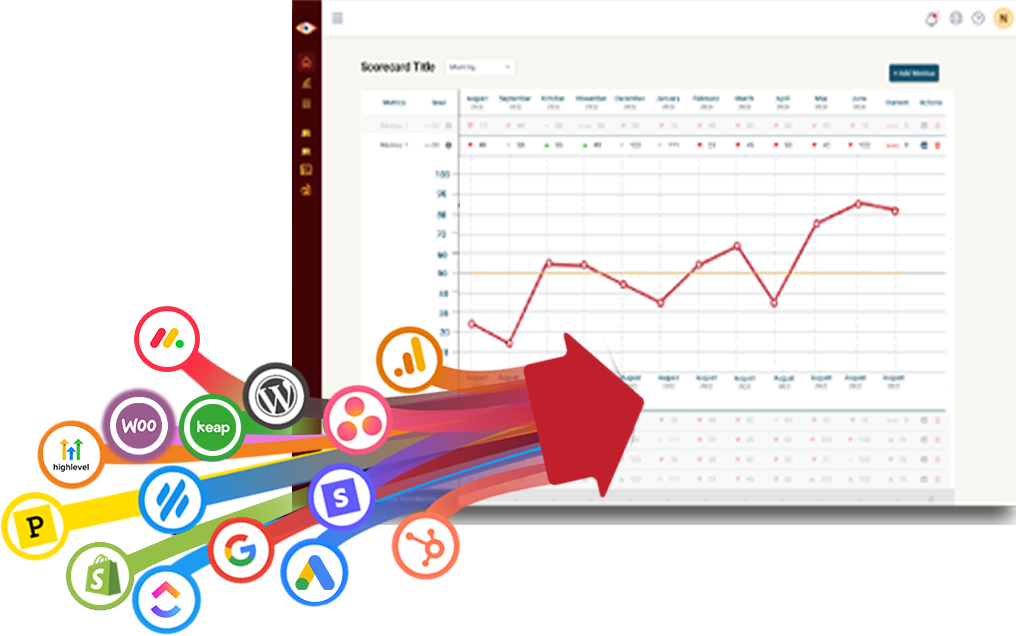
Easily connect to any business tool
We capture raw data from any platform and keep it updated continuously. You'll always have the live numbers, full history, and ability to drill into any KPI for the details that explain it.
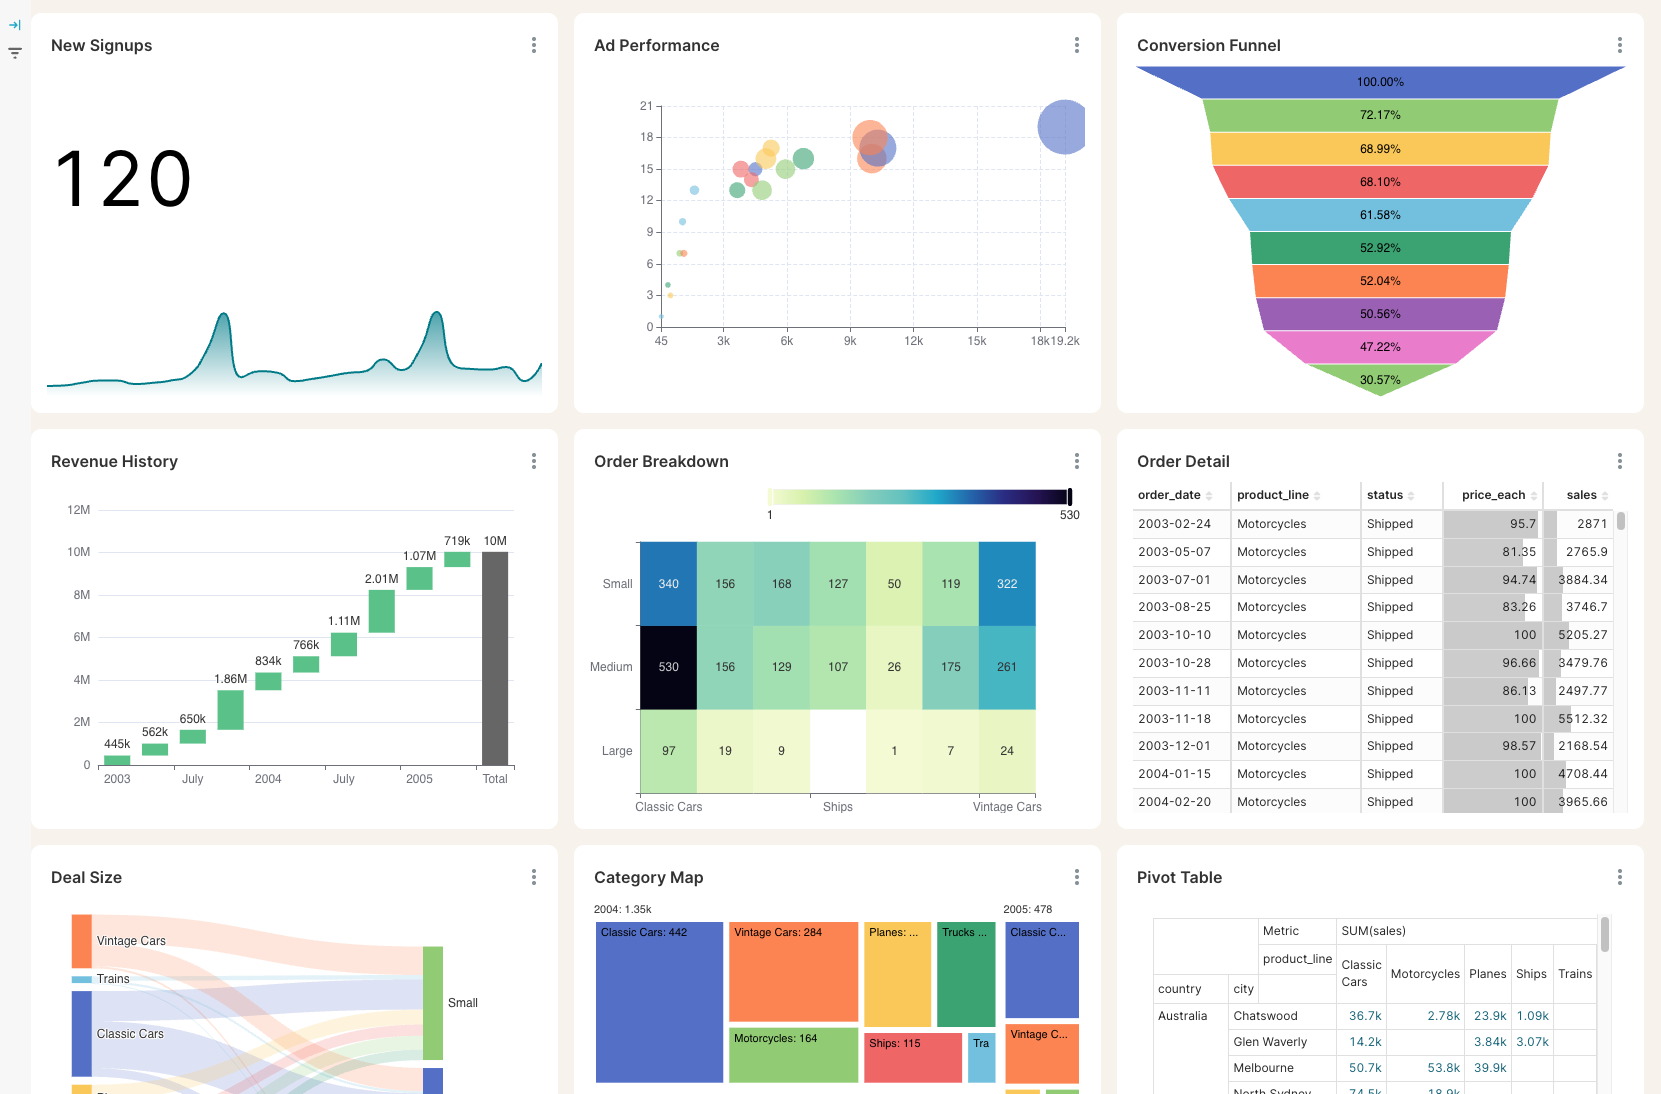
Get the reporting you never could before
Access custom reports with interactive dashboards & scorecards, giving you answers to questions you've never been able to answer easily. Look deeper into any number, explore trends, and slice & dice results by any segment.
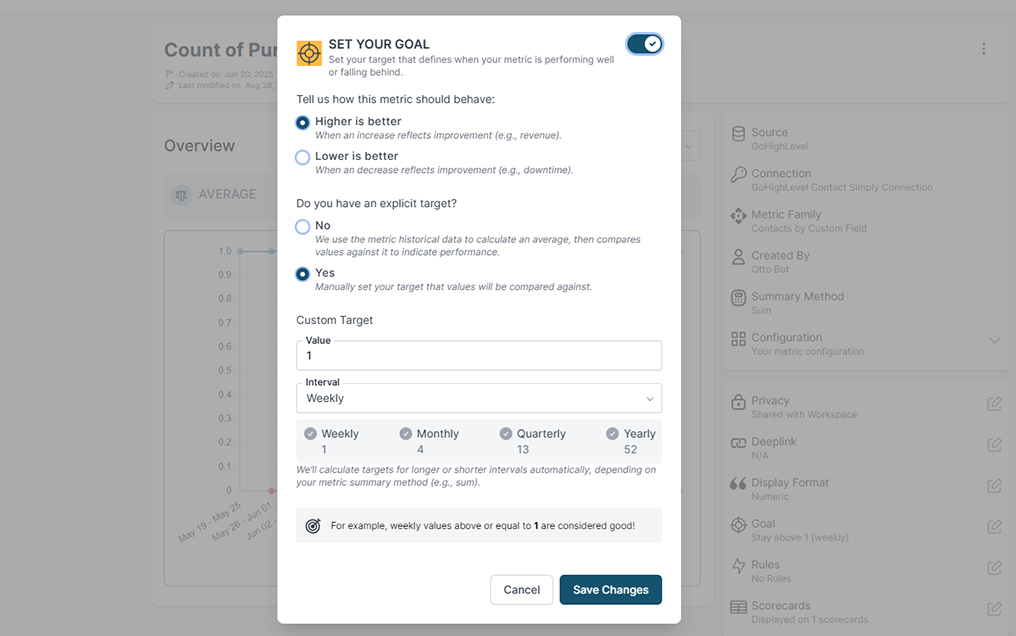
Stay on track with real time visibility & alerts
Set clear goals, track progress in real time, and get alerts the moment a KPI slips or beats target. Acting proactively & not reactively means you're no longer the last to know.
Keep your team in the loop and accountable
Keep goals front and center with reports designed for each person, team, or location — shared in real time to keep performance transparent and encourage accountability.
Do you have questions that are difficult or impossible to answer with Help Scout's built-in reporting?
BlinkMetrics gives you instant visibility into every blind spot holding your support team back.
Help Scout alone
Single-Customer Support View
Historical Reporting & Trend Analysis
Team Performance & Workload Visibility
Multi-Source Dashboards
Tag-Based Recurring-Issue Tracking
Help Scout Docs ROI
Cross-Mailbox Dashboards
Calculated KPIs & SLAs
Global Filters
Help Scout + BlinkMetrics
Single-Customer Support View
Historical Reporting & Trend Analysis
Team Performance & Workload Visibility
Multi-Source Dashboards
Tag-Based Recurring-Issue Tracking
Help Scout Docs ROI
Cross-Mailbox Dashboards
Calculated KPIs & SLAs
Global Filters
Complete visibility in 30 days — we'll build you the ultimate Help Scout reporting dashboard
Easily see what's difficult or impossible to see in Help Scout
Your burning Help Scout questions, finally answered
These are the questions support leaders ask us most often, but we'd love to dig into yours on a quick call.
-
Will my team have to wire up the Help Scout API or pull in IT?
No — your BlinkMetrics dashboard is fully done-for-you. We connect to Help Scout's API on our side, handle the data modeling, and build the reports. You just tell us what you wish you could see.
-
How fast can we get a live Help Scout dashboard in front of our team?
Connecting Help Scout and any supporting data sources (Stripe, HubSpot, your product DB) takes a few minutes. From kickoff to a live dashboard your support leaders are using day-to-day is 30 days or less, guaranteed.
-
What actually happens during a BlinkMetrics + Help Scout demo?
You'll meet with our founder, Nathan, walk through a live Help Scout dashboard, and talk through the support questions you can't answer today. By the end of the call you'll know exactly what your version could look like.
-
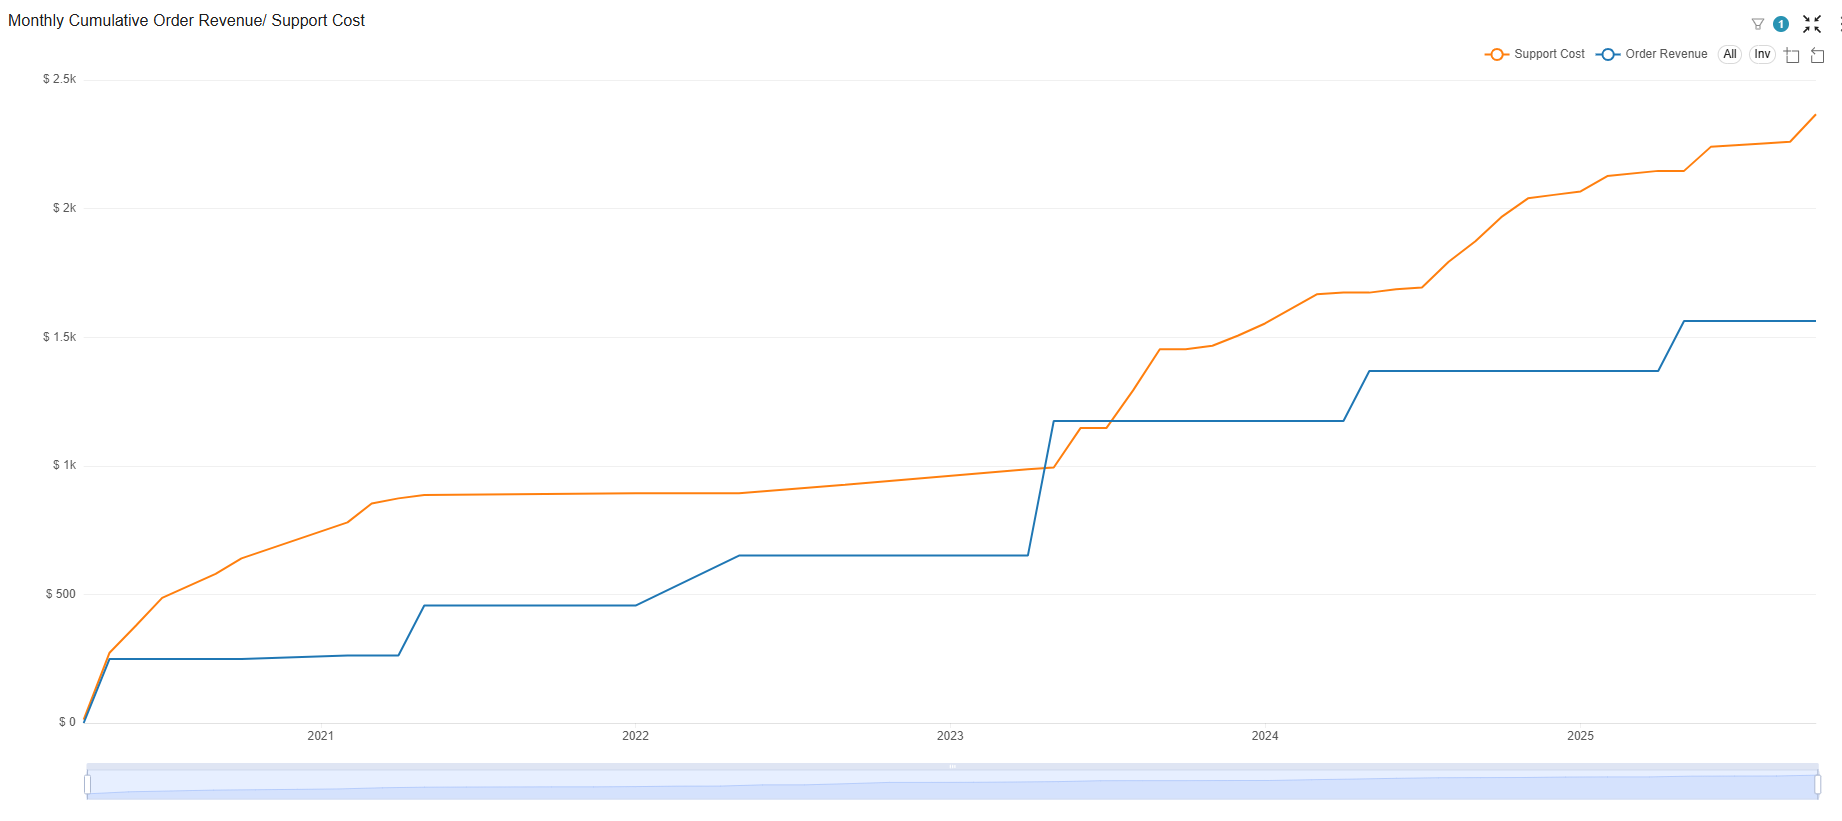
What can I see in BlinkMetrics that Help Scout's native reports don't show?
Cross-mailbox rollups, a true customer 360 that ties conversations to revenue and support cost, Docs deflection analytics, and custom KPIs like SLA attainment and first-contact resolution. The kind of answers that usually live in a spreadsheet — built into a dashboard the whole team trusts.
-
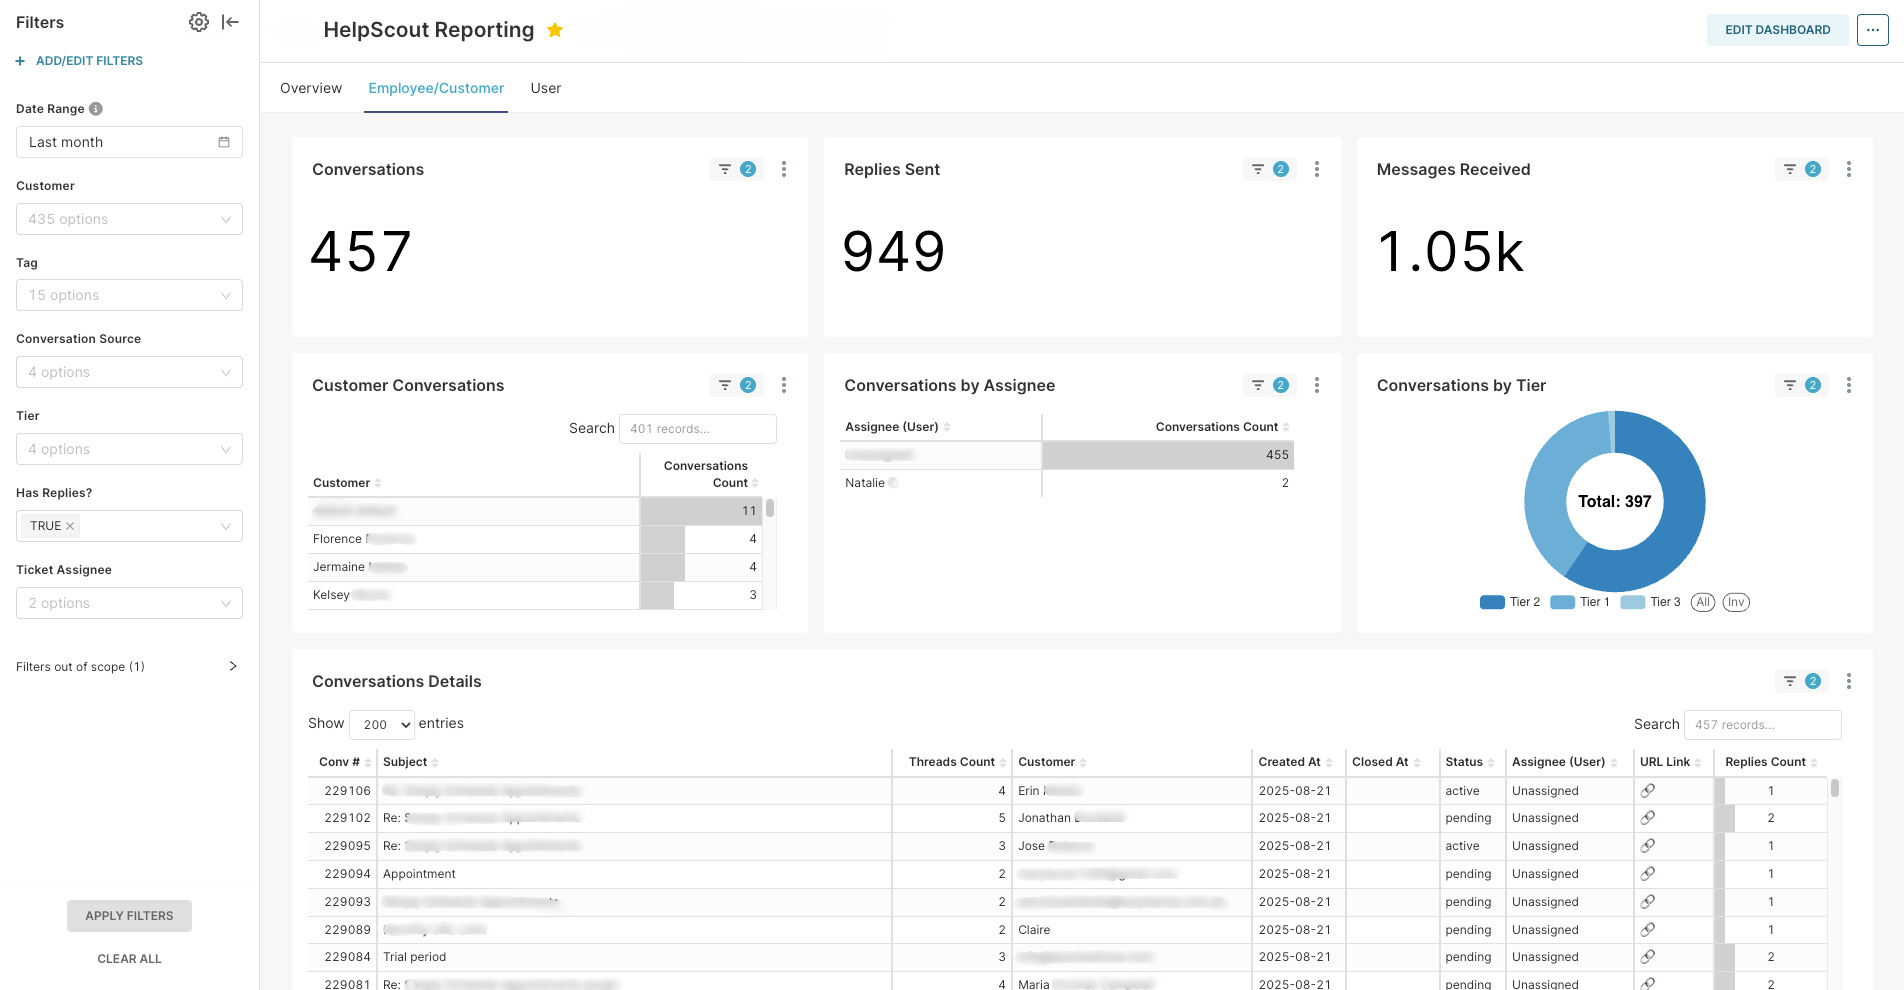
Can you build different Help Scout dashboards for different teams?
Yes. We routinely build separate views for support ops, CSAT and quality, executives, and individual mailbox owners — all from the same Help Scout data. Each audience gets the filters and KPIs that matter to them without duplicating work or fragmenting the source of truth.
-
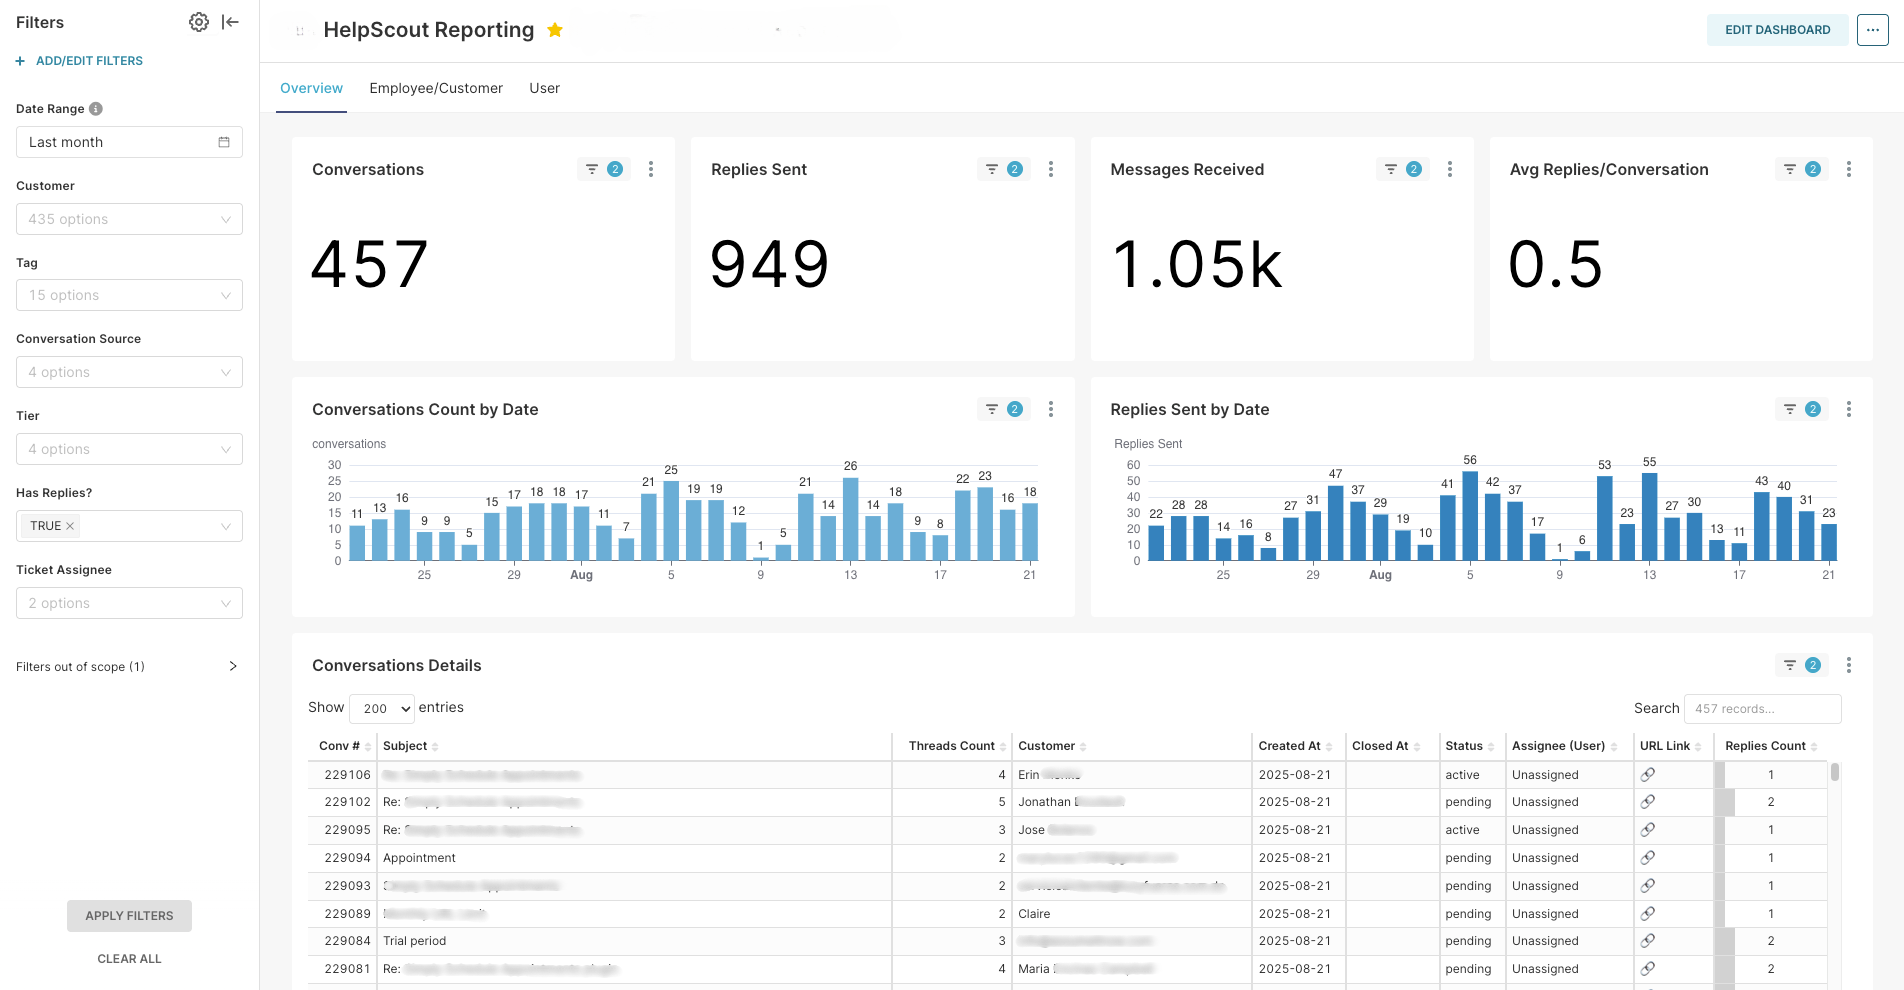
How does BlinkMetrics handle historical Help Scout reporting?
We take daily snapshots of your Help Scout data and store them in a dedicated analytics layer, so you can compare response times, conversation volume, CSAT, and tag trends across any window — week-over-week, quarter-over-quarter, or year-over-year — without manually exporting or archiving anything.

Ready for the ultimate Help Scout reporting dashboard?
We partner with support teams who run on Help Scout. We see exactly where the native reports run out of road, and we build the dashboards that close those gaps.
book a call to see what's possible