
Turn your monday.com data into live reporting dashboards
Get the historical trends, flexible segmentation, and client-ready dashboards monday.com can't deliver on its own.
book a discovery call
See BlinkMetrics in action
Move beyond monday.com's dashboard limitations. Our integration reveals the historical trends, workload patterns, and segmentation views your team needs to finally see the full story behind the data.
book demo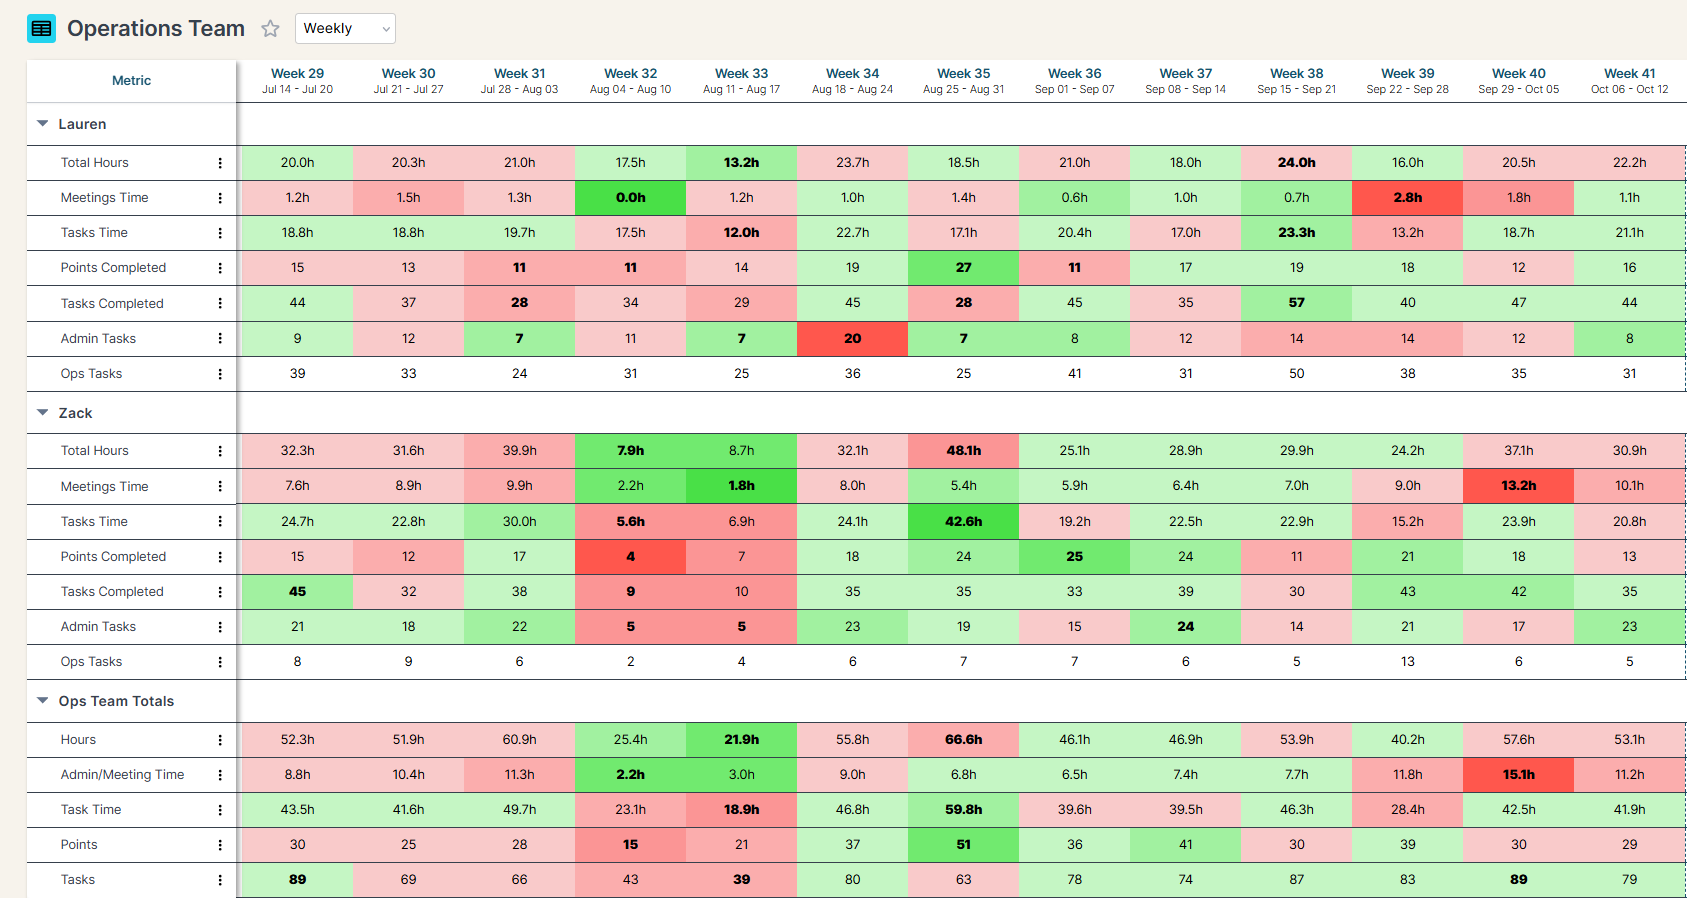
Spreadsheets get you close, but they won't get you all the way
-

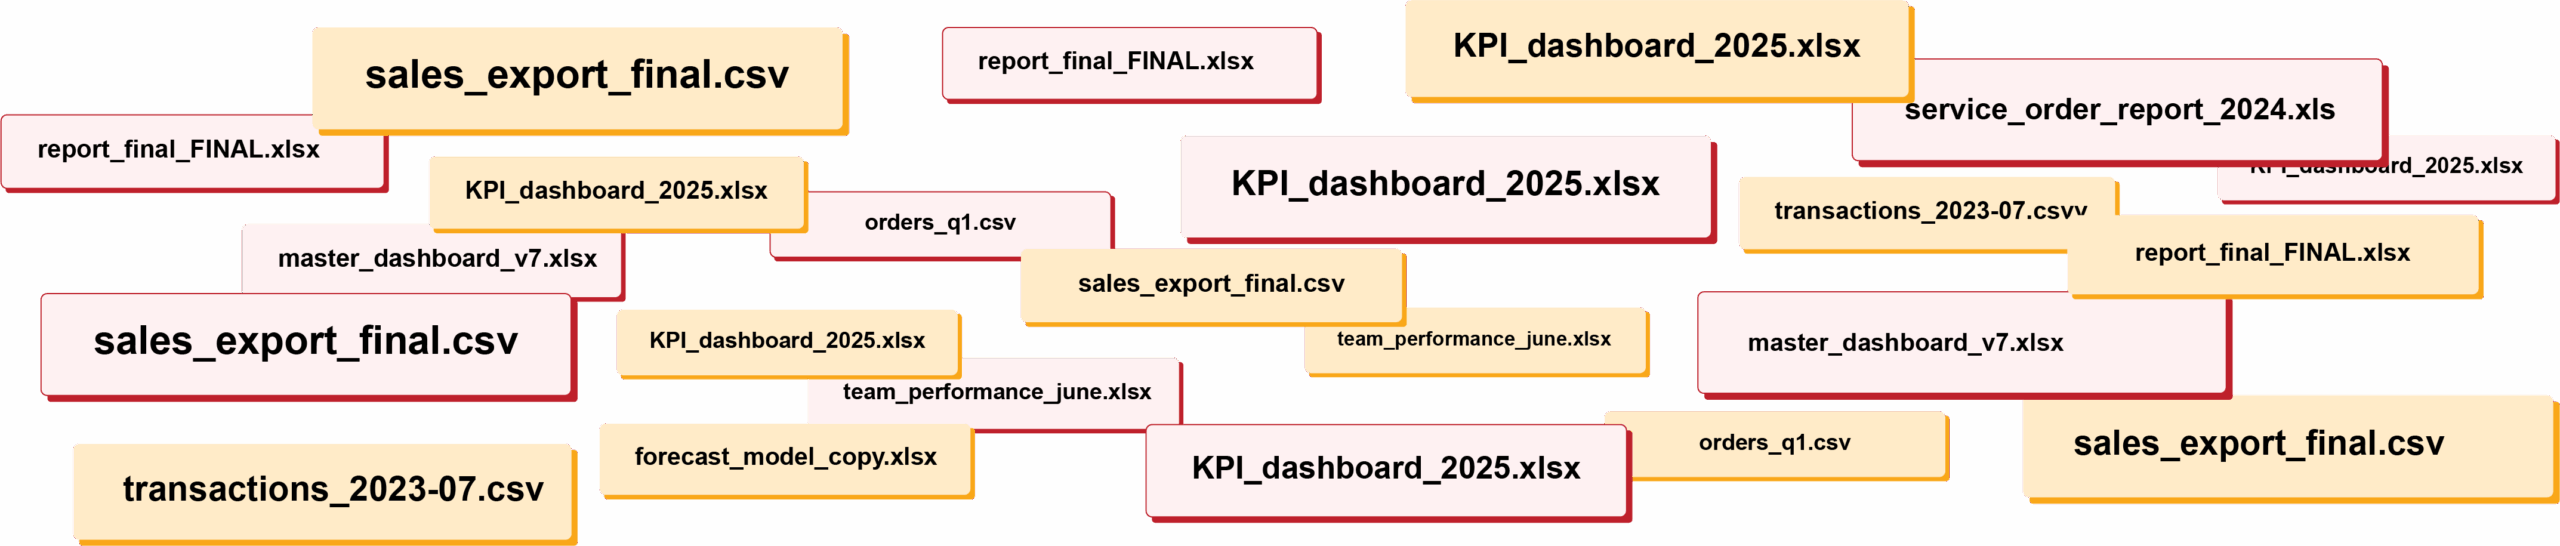
Endless CSV Exports
-
Hours to find an answer
-

Broken links, Zaps & formulas
-

Numbers are difficult to verify
-
Everything breaking as you scale
RIP spreadsheets. BlinkMetrics brings your reporting into live dashboards that show what's really happening in your business.
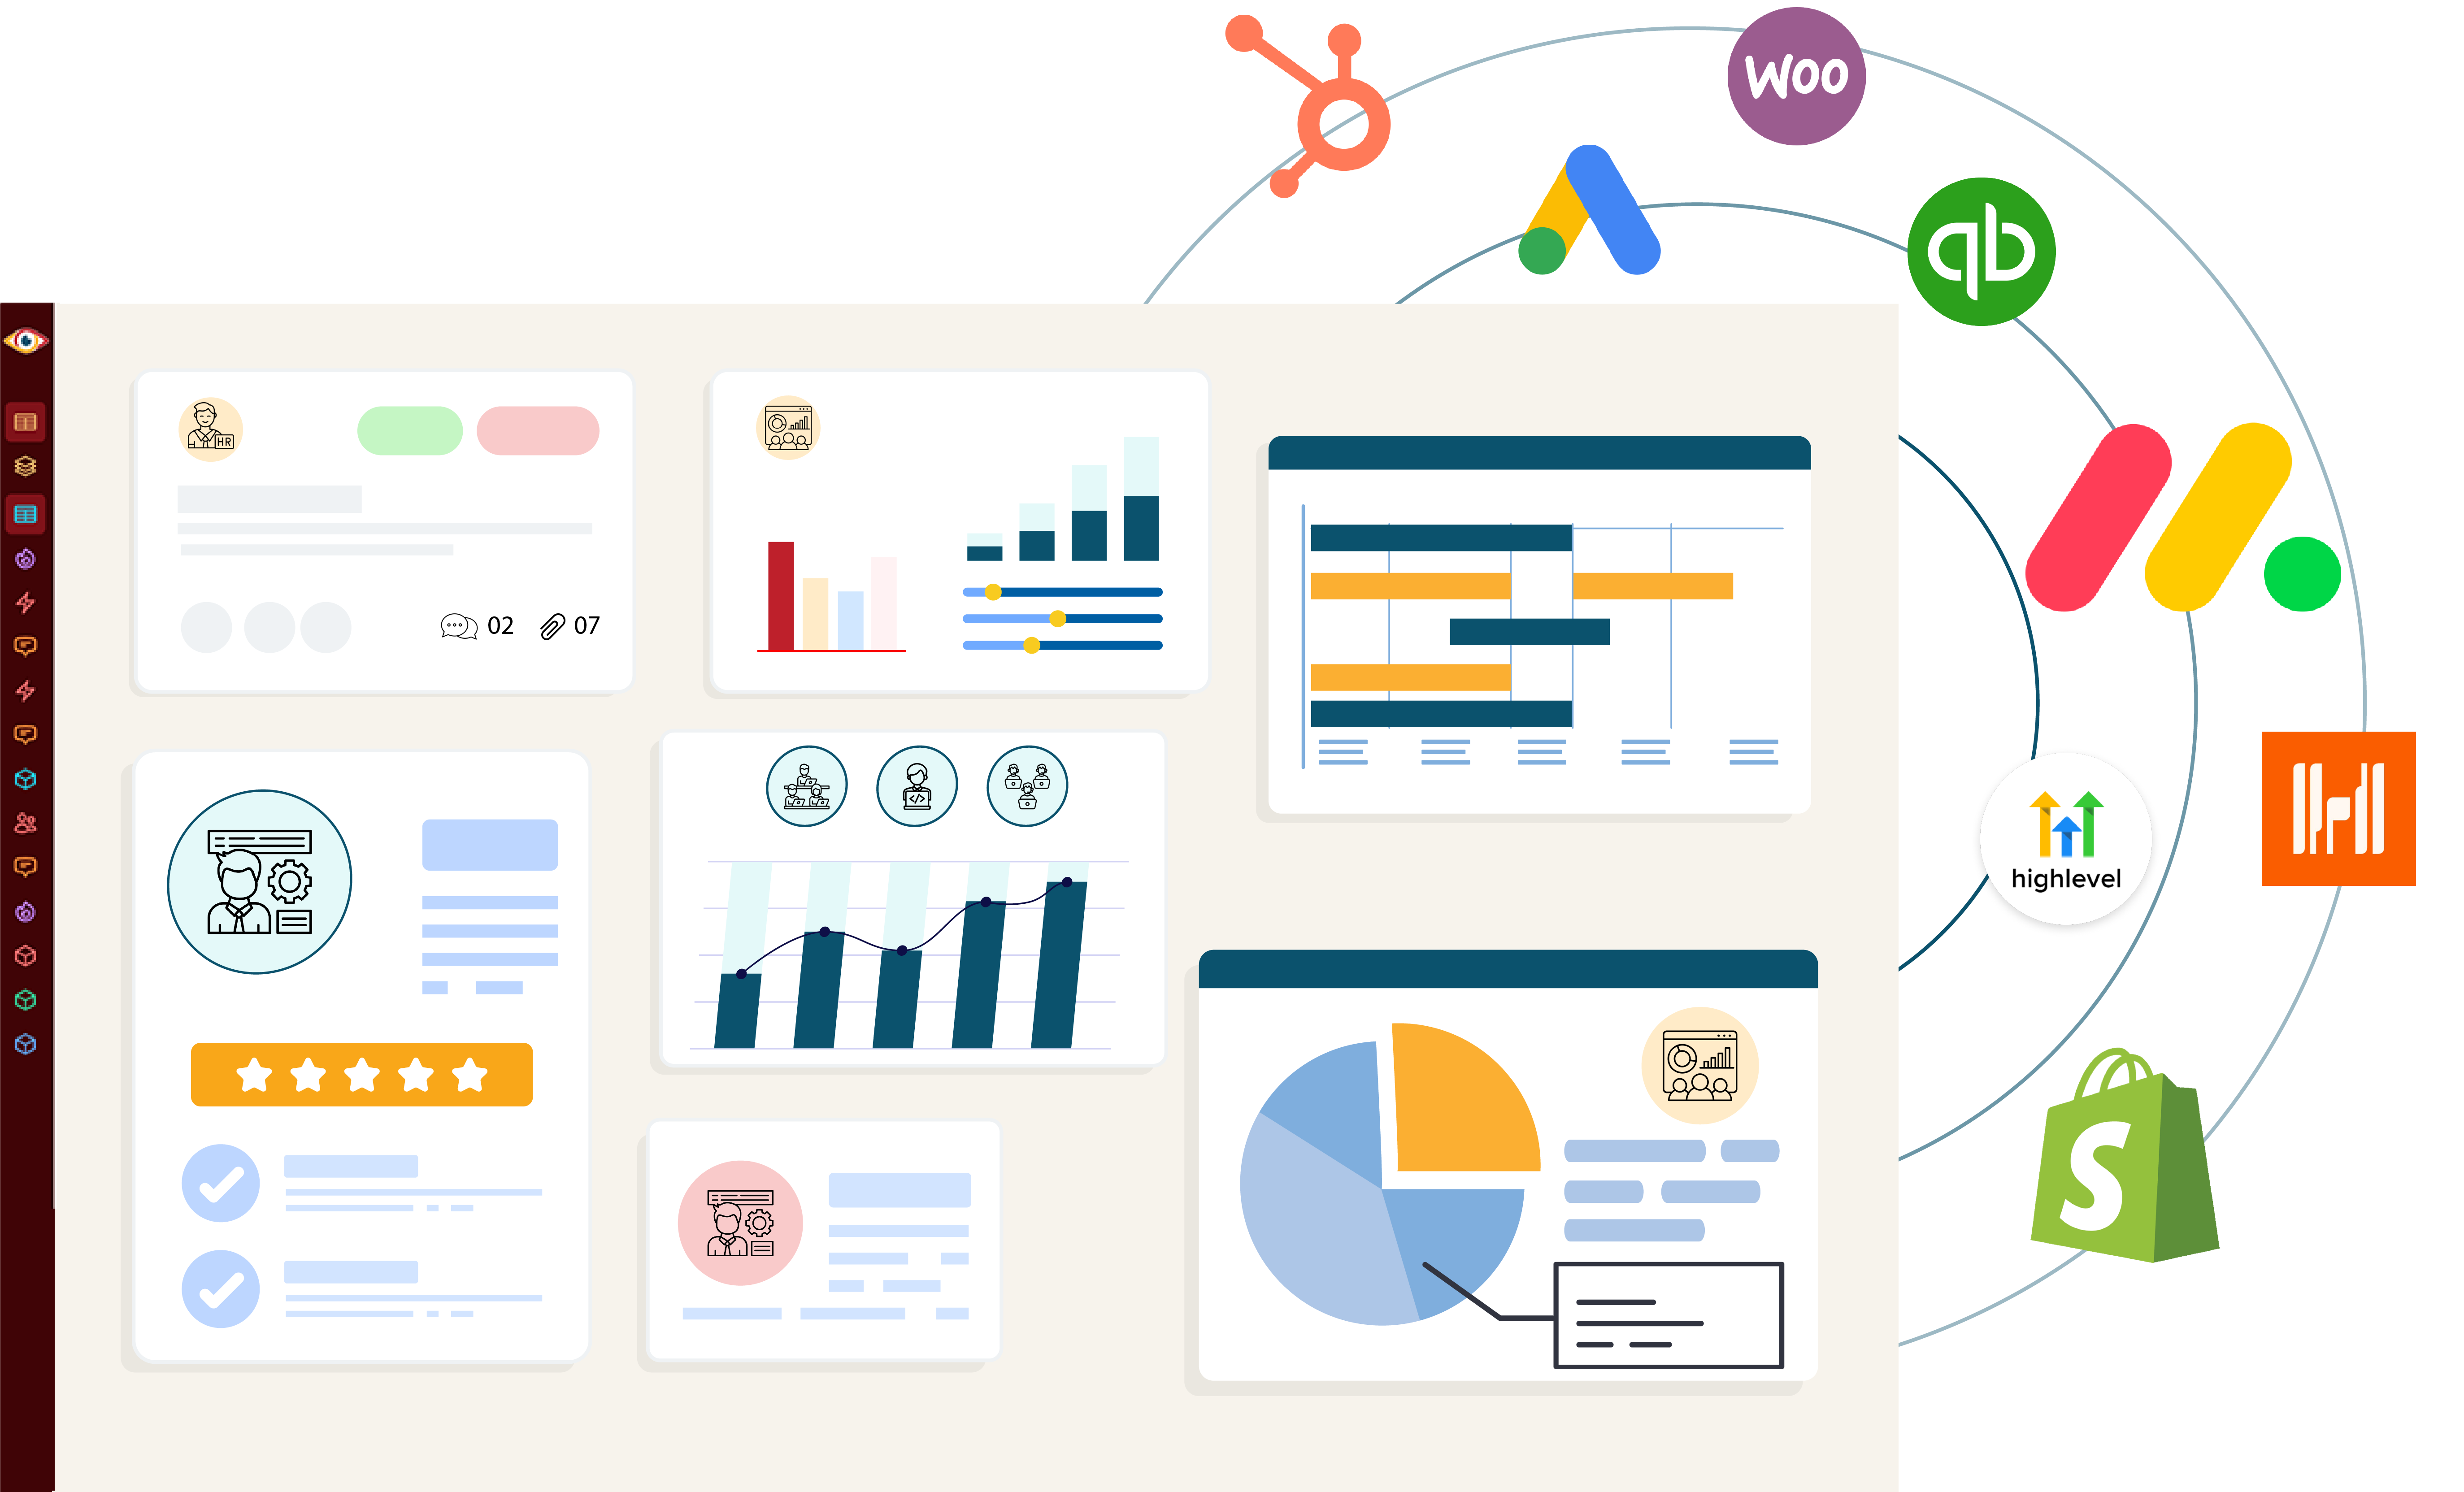
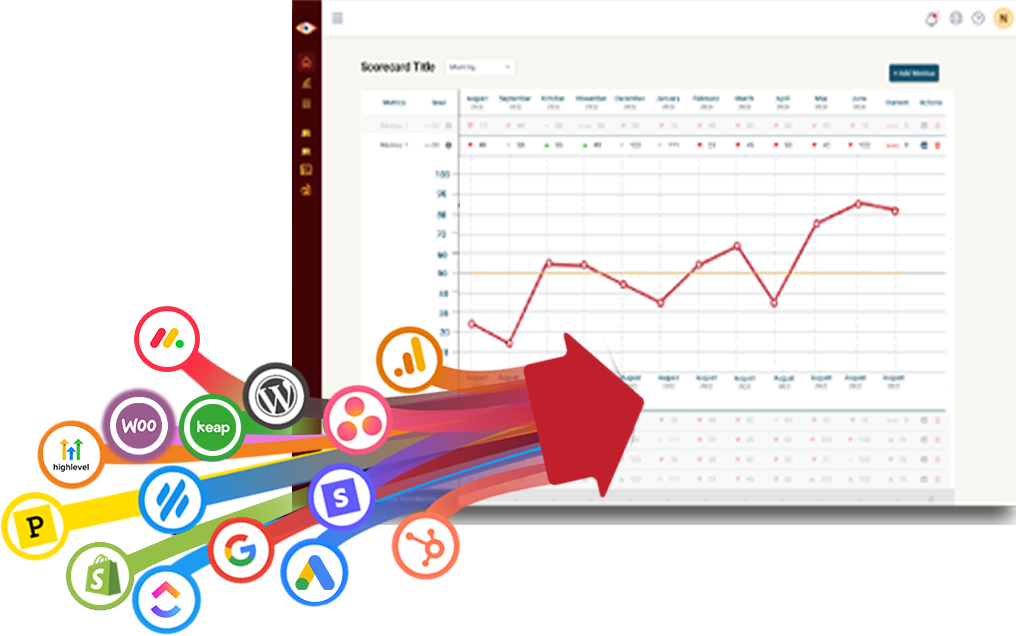
Easily connect to any business tool
We capture raw data from any platform and keep it updated continuously. You'll always have the live numbers, full history, and ability to drill into any KPI for the details that explain it.
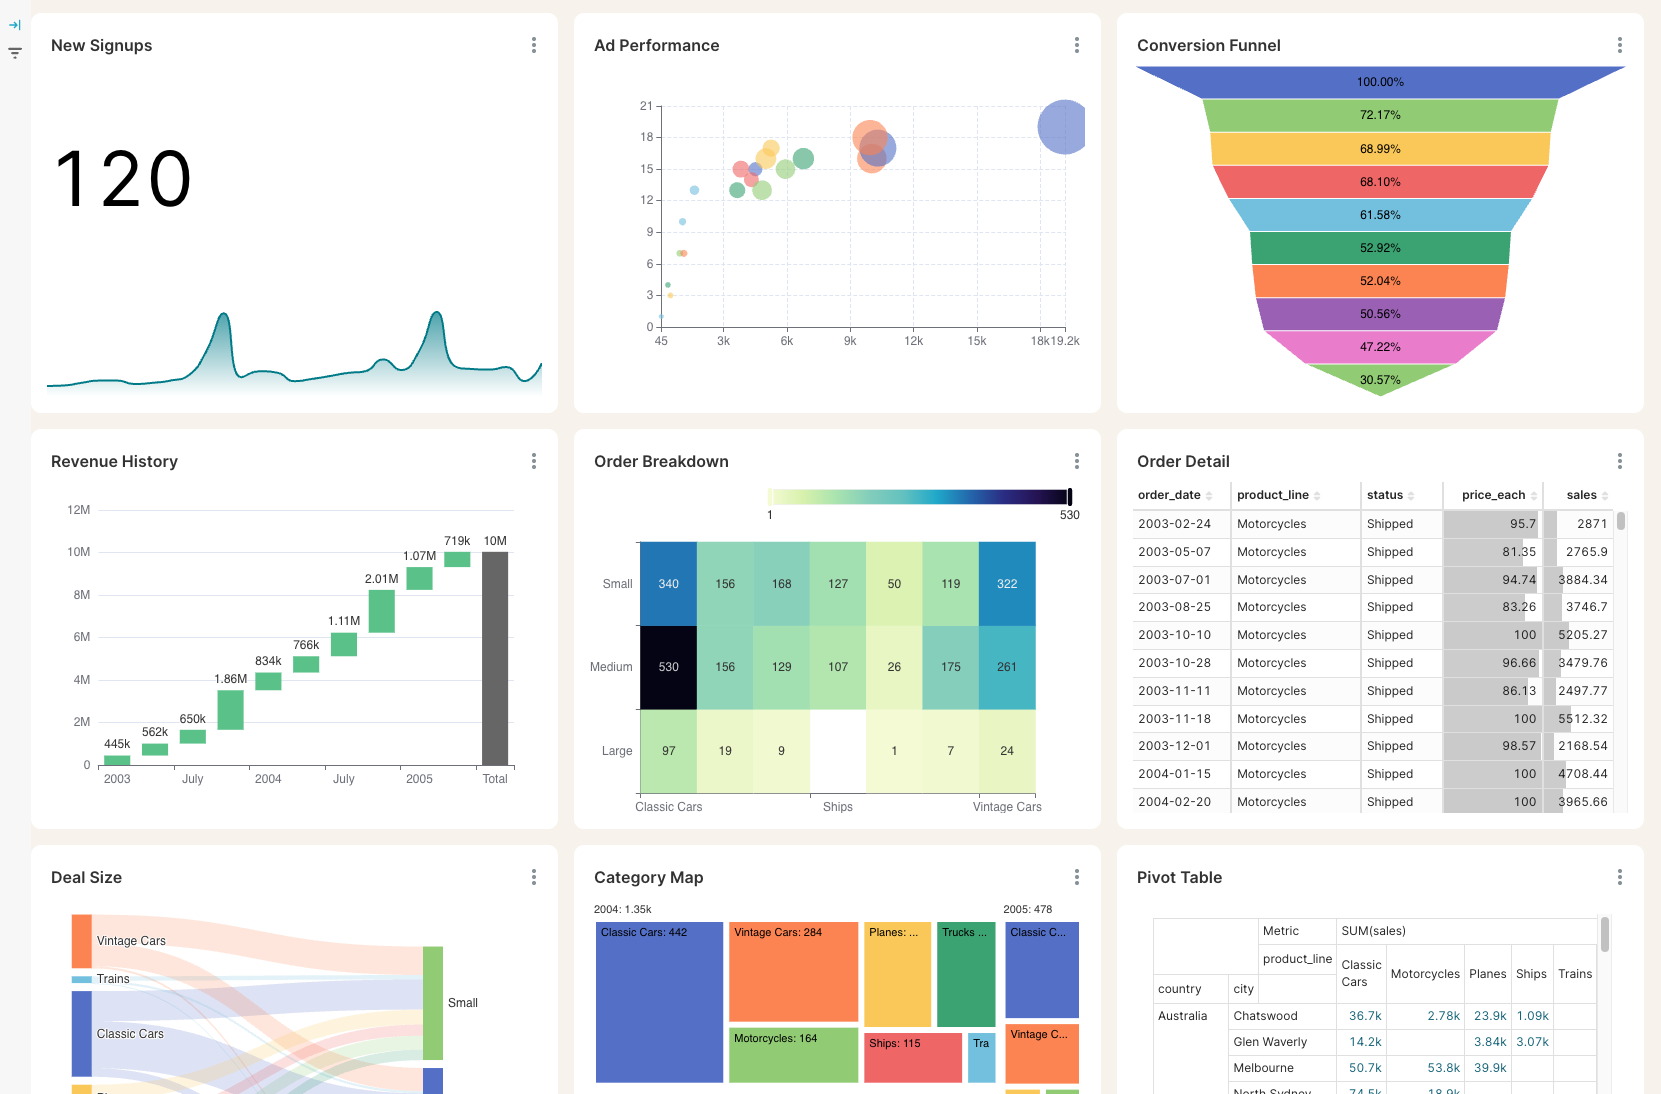
Get the reporting you never could before
Access custom reports with interactive dashboards & scorecards, giving you answers to questions you've never been able to answer easily. Look deeper into any number, explore trends, and slice & dice results by any segment.
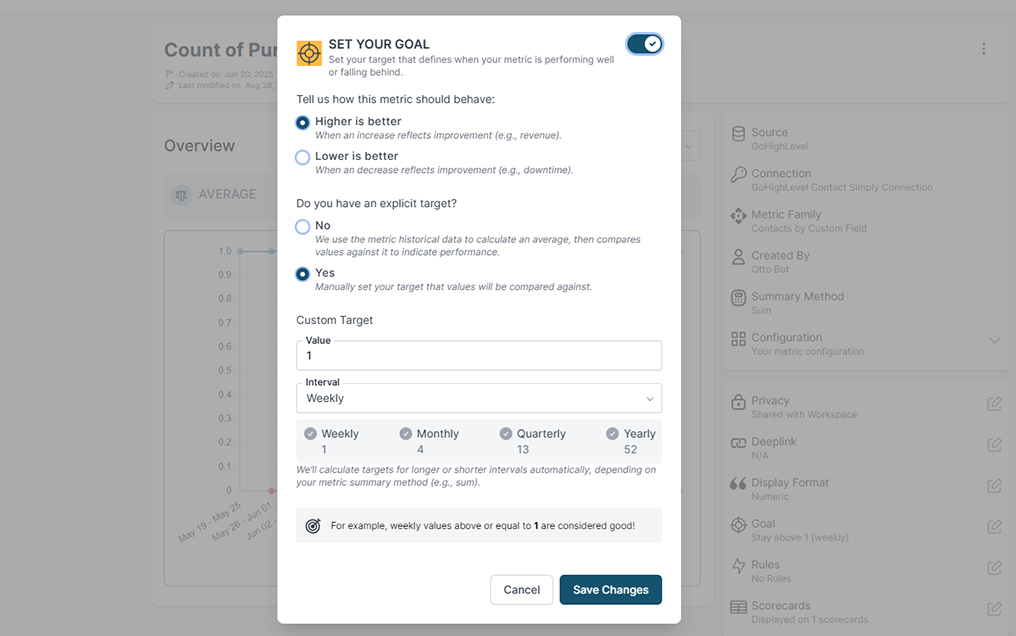
Stay on track with real time visibility & alerts
Set clear goals, track progress in real time, and get alerts the moment a KPI slips or beats target. Acting proactively & not reactively means you're no longer the last to know.
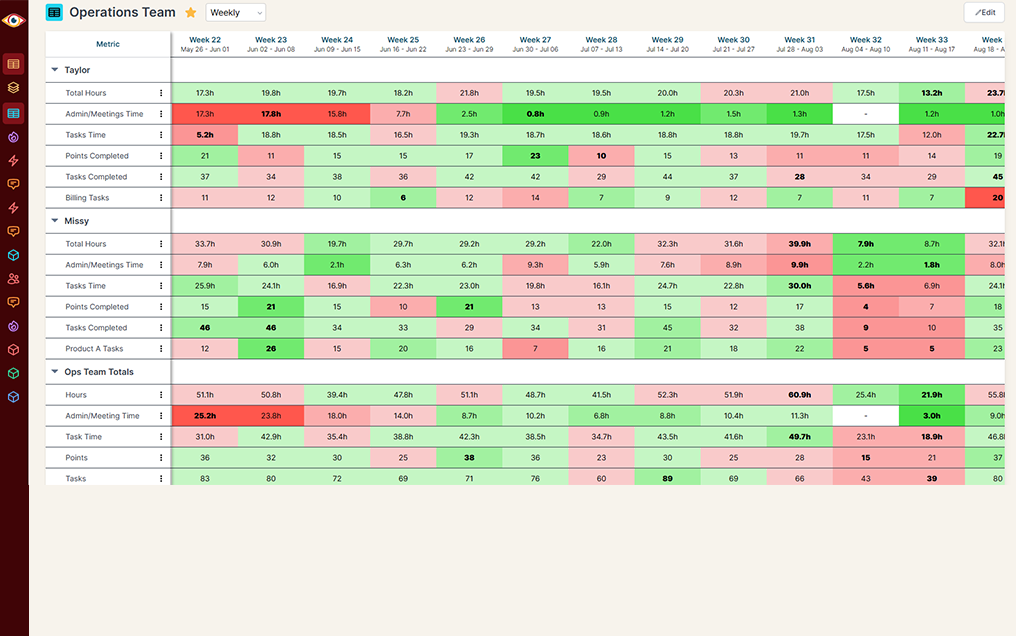
Keep your team in the loop and accountable
Keep goals front and center with reports designed for each person, team, or location — shared in real time to keep performance transparent and encourage accountability.
Do you have questions that are difficult or impossible to answer with monday.com's built-in reporting?
monday.com is great for organizing tasks, but it stops short of showing the big picture. BlinkMetrics replaces the blind spots with historical context, flexible segmentation, and easy-to-share dashboards that reveal the impact behind the work.
monday.com alone
Historical Reporting
Data Segmentation
Reporting Depth
Setup & Maintenance
Cross-Board Dashboards
Multi-Source Dashboards
Sharing & Permissions
Calculated Metrics, KPIs, & Formulas
Global Filters
monday.com + BlinkMetrics
Historical Reporting
Data Segmentation
Reporting Depth
Setup & Maintenance
Cross-Board Dashboards
Multi-Source Dashboards
Sharing & Permissions
Calculated Metrics, KPIs, & Formulas
Global Filters
Complete visibility in 30 days — we'll build you the ultimate monday.com reporting dashboard
Easily see what's difficult or impossible to see in monday.com
Got questions? We've got answers
From setup to smarter reporting, here's what monday.com users often ask before getting started with BlinkMetrics.
-
How long does it take to set up BlinkMetrics with monday.com?
Setup is quick and simple. Connect your monday.com account and other data sources in just minutes. No complex tech skills are required — get instant visibility into your metrics without the wait.
-
Does BlinkMetrics replace monday.com?
No. monday.com stays your project hub — we simply add the reporting depth and analytics it's missing.
-
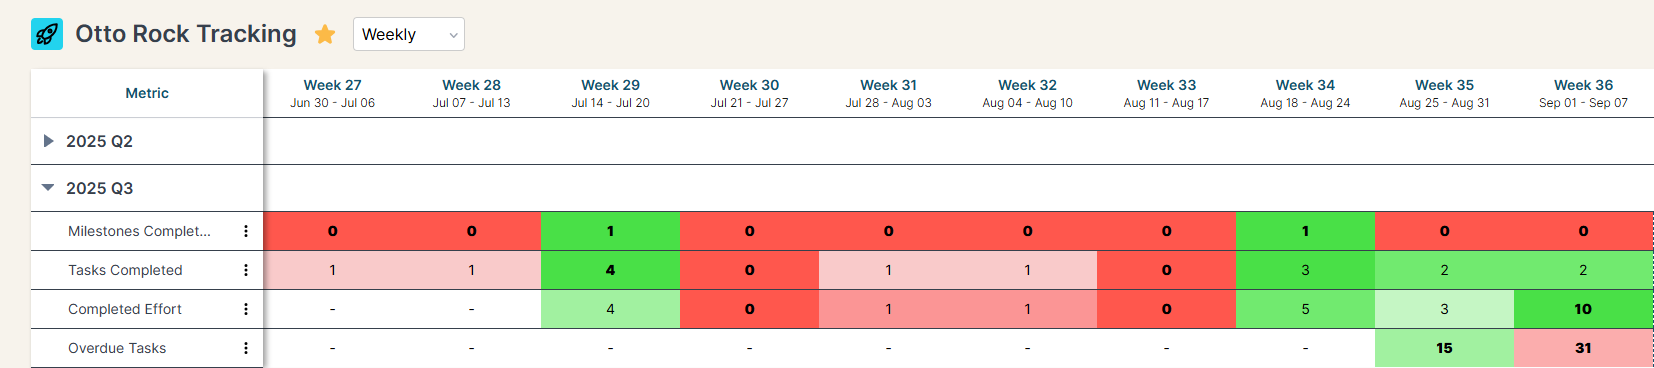
Can I track performance over time?
Yes. We capture daily snapshots so you can see trends across weeks, months, and quarters instead of only today's numbers.
-
Will it work if I manage multiple boards?
Absolutely. BlinkMetrics consolidates data from all your boards into unified reports — no more manual exports or merging.
-
Can I share dashboards with executives or clients?
Yes. We create curated dashboards so each audience gets the view that matters without the noise.
-
How much maintenance is required?
None on your side. Our team sets everything up and maintains your reporting so it runs automatically. Book a demo to see it in action with your own data.

Ready for the ultimate monday.com reporting dashboard?
We work with teams who run their business on monday.com. We know exactly where the native dashboards run out of road — historical trends, cross-board rollups, and shareable views — and we build the reporting that closes every gap.
book a call to see what's possible