
Stripe processes payments. BlinkMetrics reveals the full story.
Stop flipping dashboards and exporting CSVs — BlinkMetrics turns Stripe payments, payouts, and subscriptions into insights you can act on today.
book a discovery call
See BlinkMetrics in action
Go beyond Stripe's built-in reports. See how our Stripe integration reveals hidden transaction patterns, simplifies payout visibility, and gives your team the clarity Stripe Sigma can't.
book demo

Spreadsheets get you close, but they won't get you all the way
-

Endless CSV Exports
-

Hours to find an answer
-

Broken links, Zaps & formulas
-

Numbers are difficult to verify
-

Everything breaking as you scale
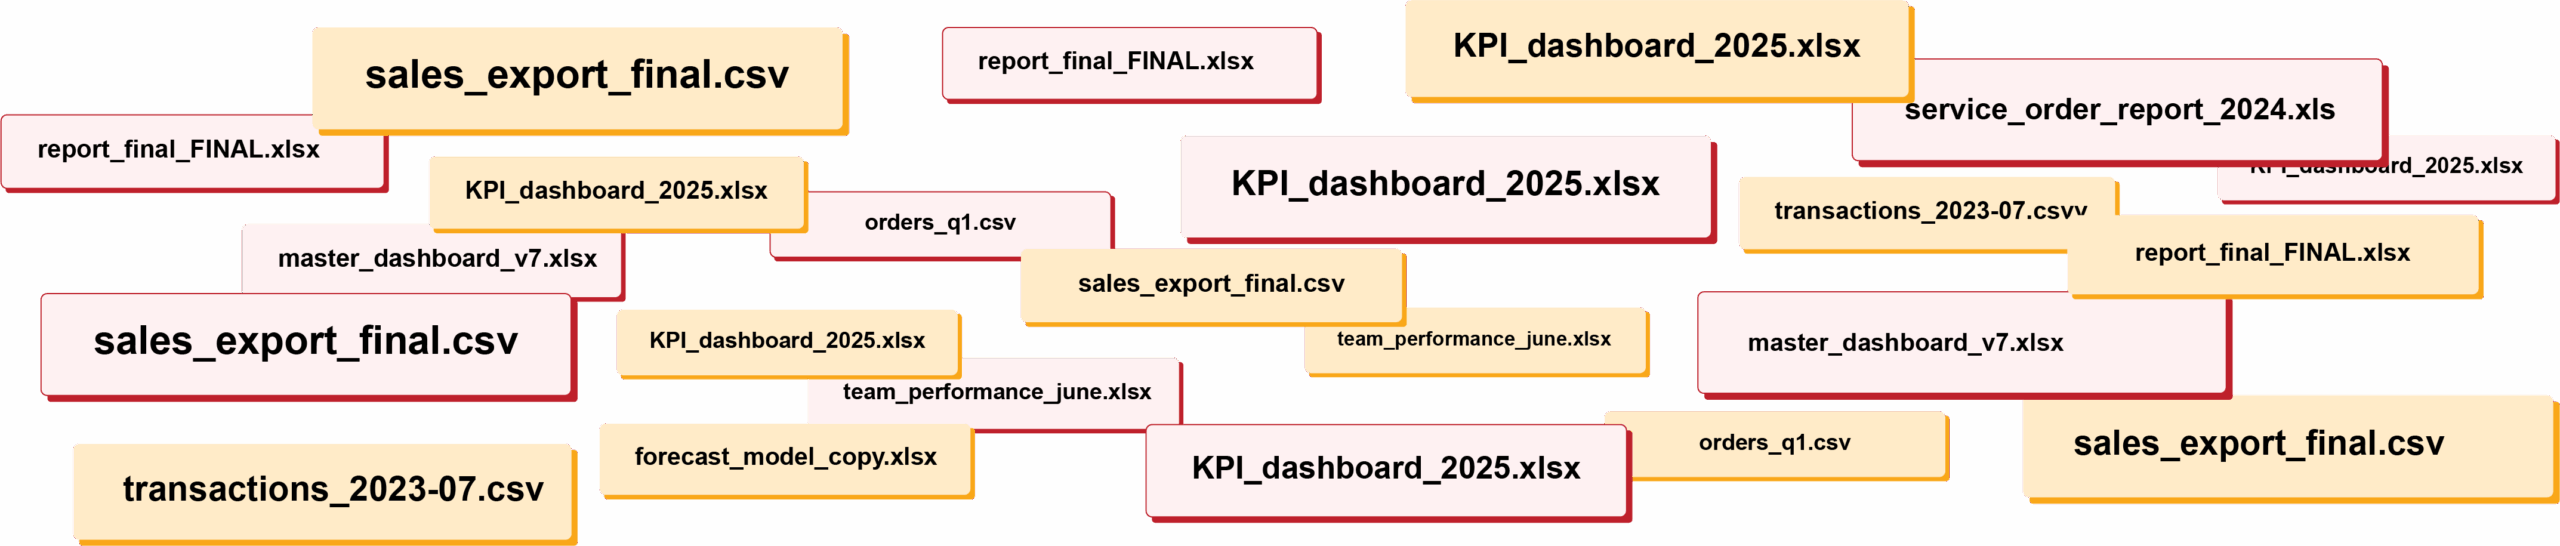
RIP spreadsheets. BlinkMetrics brings your reporting into live dashboards that show what's really happening in your business.
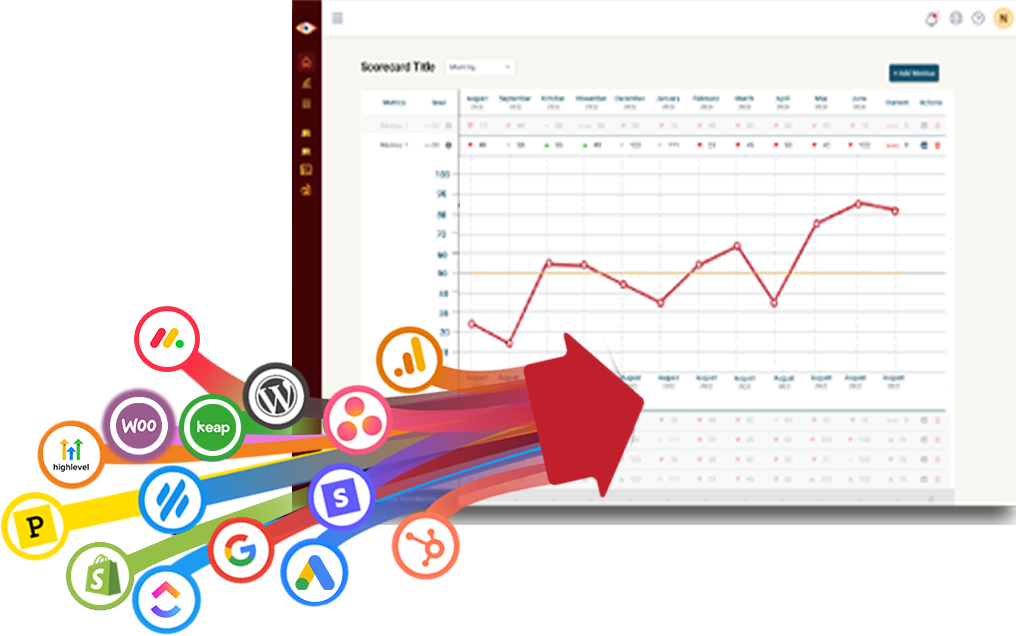
Easily connect to any business tool
We capture raw data from any platform and keep it updated continuously. You'll always have the live numbers, full history, and ability to drill into any KPI for the details that explain it.
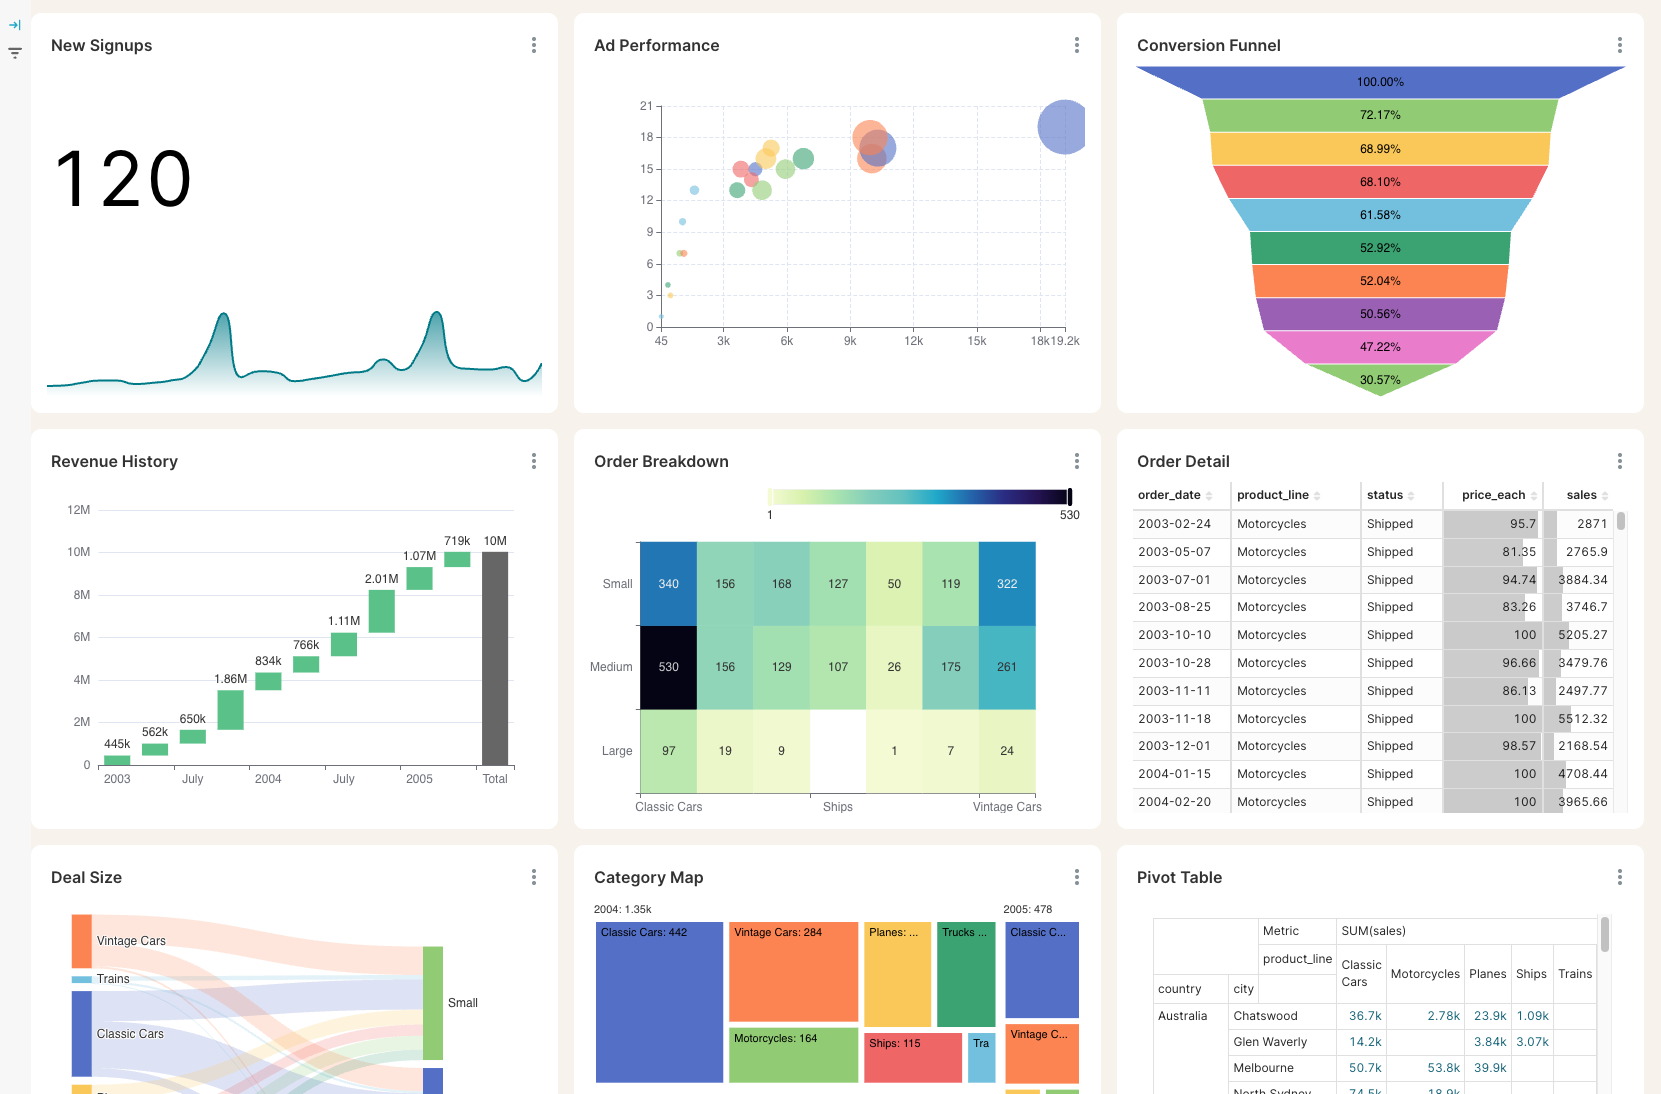
Get the reporting you never could before
Access custom reports with interactive dashboards & scorecards, giving you answers to questions you've never been able to answer easily. Look deeper into any number, explore trends, and slice & dice results by any segment.
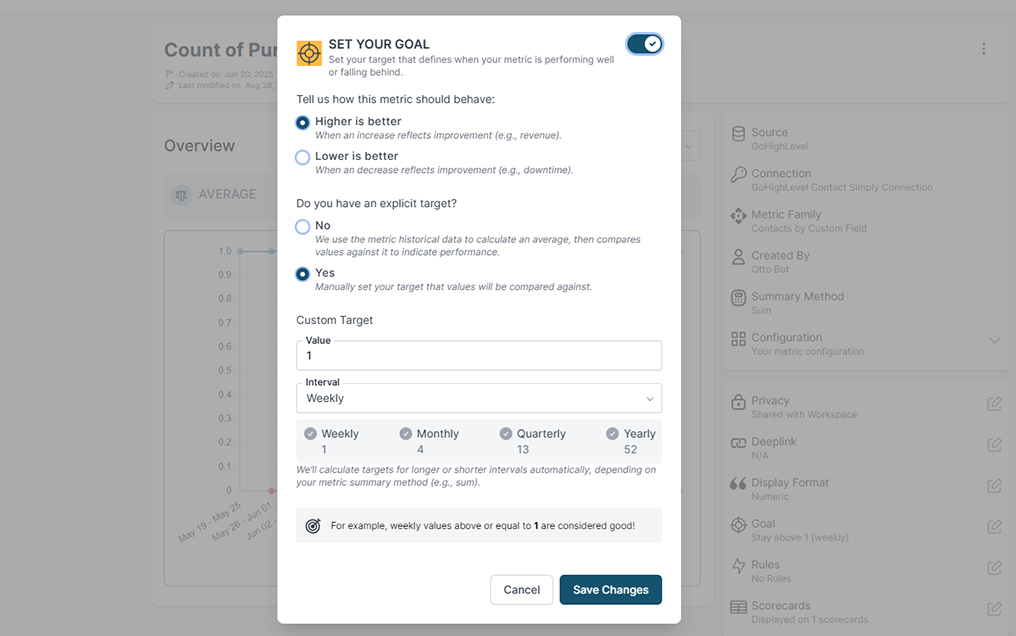
Stay on track with real time visibility & alerts
Set clear goals, track progress in real time, and get alerts the moment a KPI slips or beats target. Acting proactively & not reactively means you're no longer the last to know.
Keep your team in the loop and accountable
Keep goals front and center with reports designed for each person, team, or location — shared in real time to keep performance transparent and encourage accountability.
The blind spots holding your Stripe reports back
Managing payments in Stripe should be simple, not stressful. But if you're jumping between dashboards, exporting CSVs, or considering costly add-ons just to get basic insights — you're not alone. BlinkMetrics closes the gaps between Stripe payments, Connect payouts, subscriptions, and the customer data that explains them.
Stripe alone
Stripe Connect Payout Visibility
Revenue Segmentation
Cost Of Deeper Analytics
Multi-Source Dashboards
Fee And Refund Drill-Down
Subscription And MRR Reporting
Historical Trend Analysis
Calculated KPIs And Custom Metrics
Global Filters Across The Dashboard
Stripe + BlinkMetrics
Stripe Connect Payout Visibility
Revenue Segmentation
Cost Of Deeper Analytics
Multi-Source Dashboards
Fee And Refund Drill-Down
Subscription And MRR Reporting
Historical Trend Analysis
Calculated KPIs And Custom Metrics
Global Filters Across The Dashboard
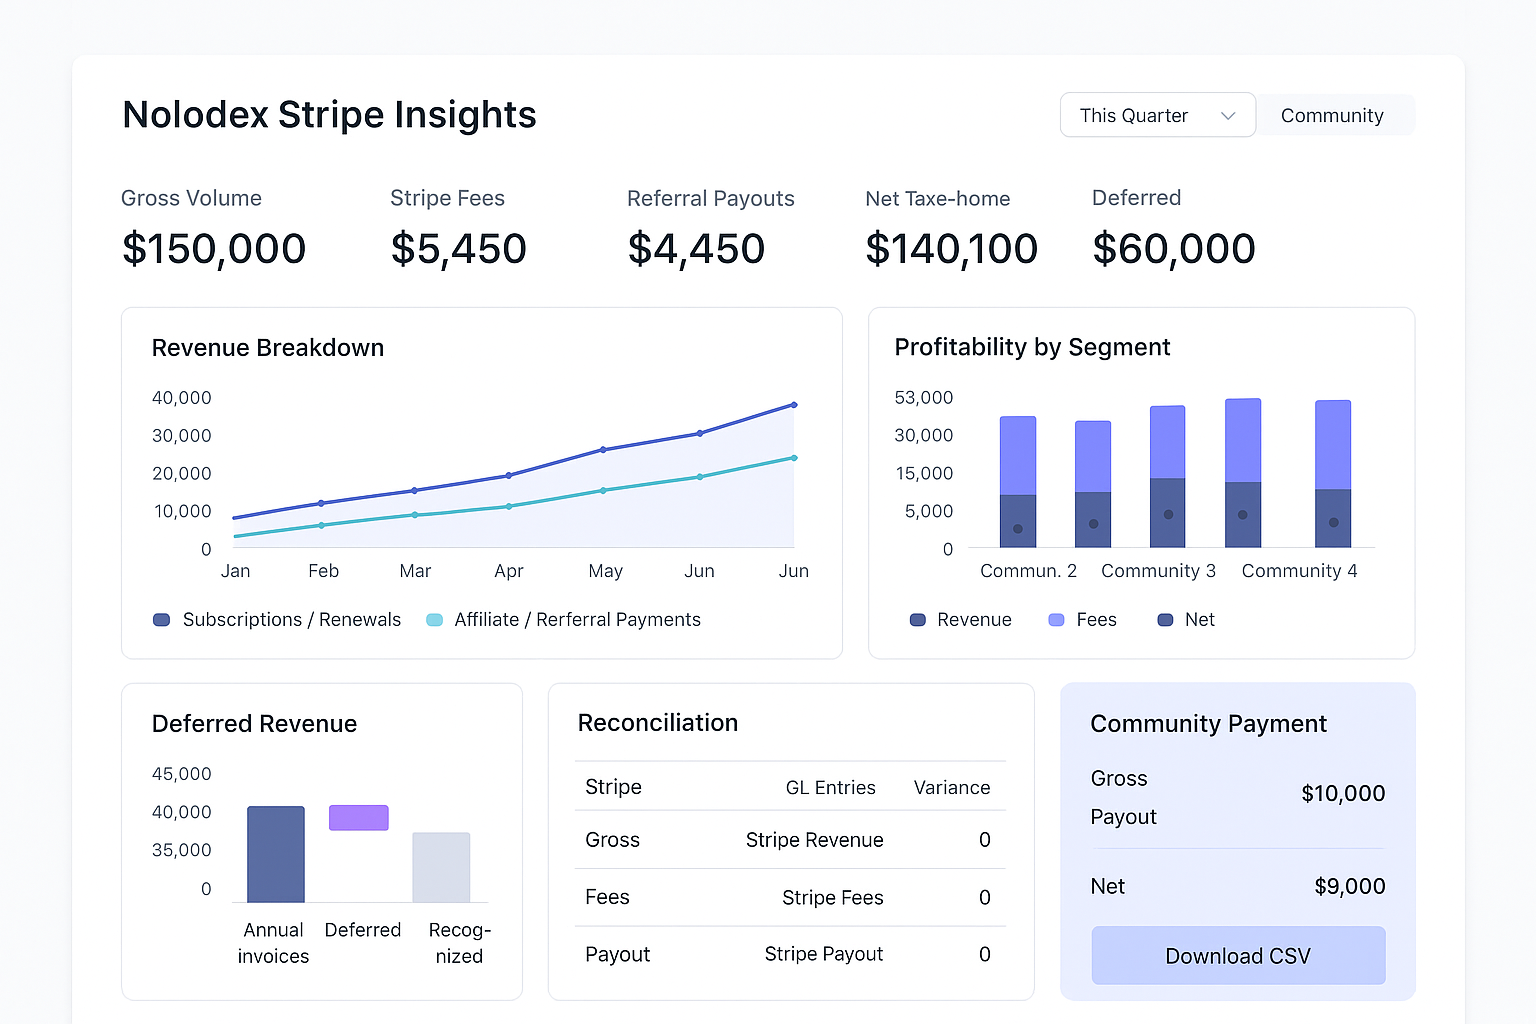
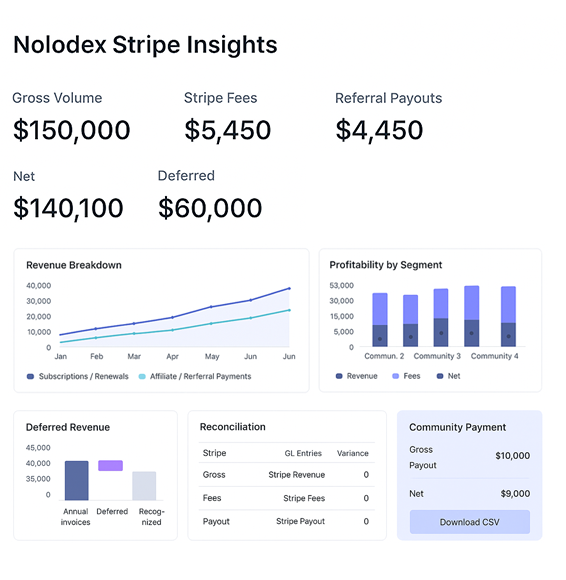
Complete visibility in 30 days — we'll build you the ultimate Stripe reporting dashboard
Easily see what's difficult or impossible to see in Stripe
Got questions? We've got answers
From setup to reporting, here are the most common questions teams ask before getting started with BlinkMetrics for Stripe.
-
How long does it take to set up BlinkMetrics with Stripe?
Setup is quick — connect your Stripe account to BlinkMetrics in just a few minutes. Our team then delivers your custom dashboard in 30 days or less. No developer required.
-
Do I need a developer to integrate BlinkMetrics?
No. BlinkMetrics is fully no-code — our white-glove team handles the entire setup for you, so you can start analyzing Stripe data without technical headaches.
-
What type of insights will I see beyond Stripe's built-in reports?
You'll uncover fee-level details, product or customer-based segmentation, MRR and churn by cohort, and connected-account analytics that go far beyond Stripe's native dashboard or Sigma.
-
Can I combine my Stripe data with other platforms?
Yes. BlinkMetrics lets you blend Stripe revenue with QuickBooks, HubSpot, Shopify, WooCommerce, GA, and 100+ other platforms to reveal a complete view of customer performance and profitability.
-
Will my data stay secure?
Absolutely. We connect via Stripe's official API and follow strict security protocols to keep your financial and customer data protected.
-
Is there a trial or demo available?
Yes. Book a free demo with our team to see how BlinkMetrics turns your Stripe data into actionable insights before you commit.


Ready for the ultimate Stripe reporting dashboard?
We've worked with Stripe-powered businesses for years. We know where Stripe's reporting falls short — Connect payouts, fee margins, MRR by cohort, and cross-system attribution — and we've built the dashboards that fill every gap.
book a call to see what's possible