
Clarity and control when every dollar and minute counts
If your business isn't thriving, you need answers. BlinkMetrics® pairs done-for-you custom dashboards with a fractional data team to monitor your business health, reveal profit leaks, and focus your limited resources on the moves that pull you out of survival and into sustainable profitability.
Small business leaders are working harder than ever, but the noise and pressure keep building.
-
I need time for strategic work, but I spend all day just fighting fires.
-
I’m overwhelmed by data and reports, I don’t know what’s important or what to do next.
-

We’re a small team wearing too many hats. There’s just not enough time to learn complex tools or analytics.
-
We can’t afford missteps; every dollar and hour counts.
To break the cycle, you need a clear, data-backed plan of action, not more confusing or incomplete information.
Turn anxiety into calm control with a clear plan of action that's ready to execute.
When you’re fighting fires, you can’t afford noise. BlinkMetrics cuts through the chaos, quickly surfacing leaks and quick wins so you can make confident strategic decisions that stabilize cash flow and prioritize the few actions that will have the greatest impact.
-
Stop the leaks before they become a crisis.
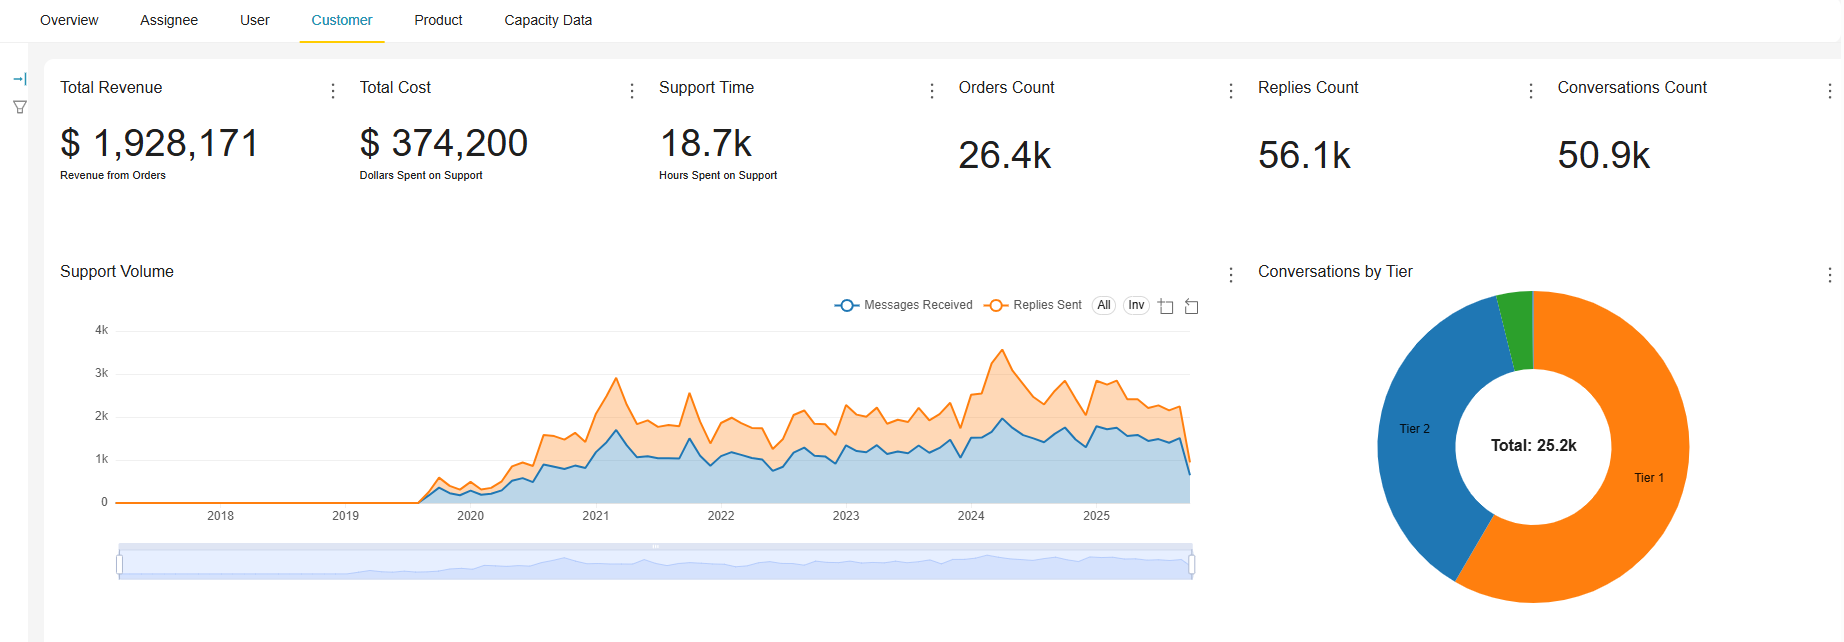
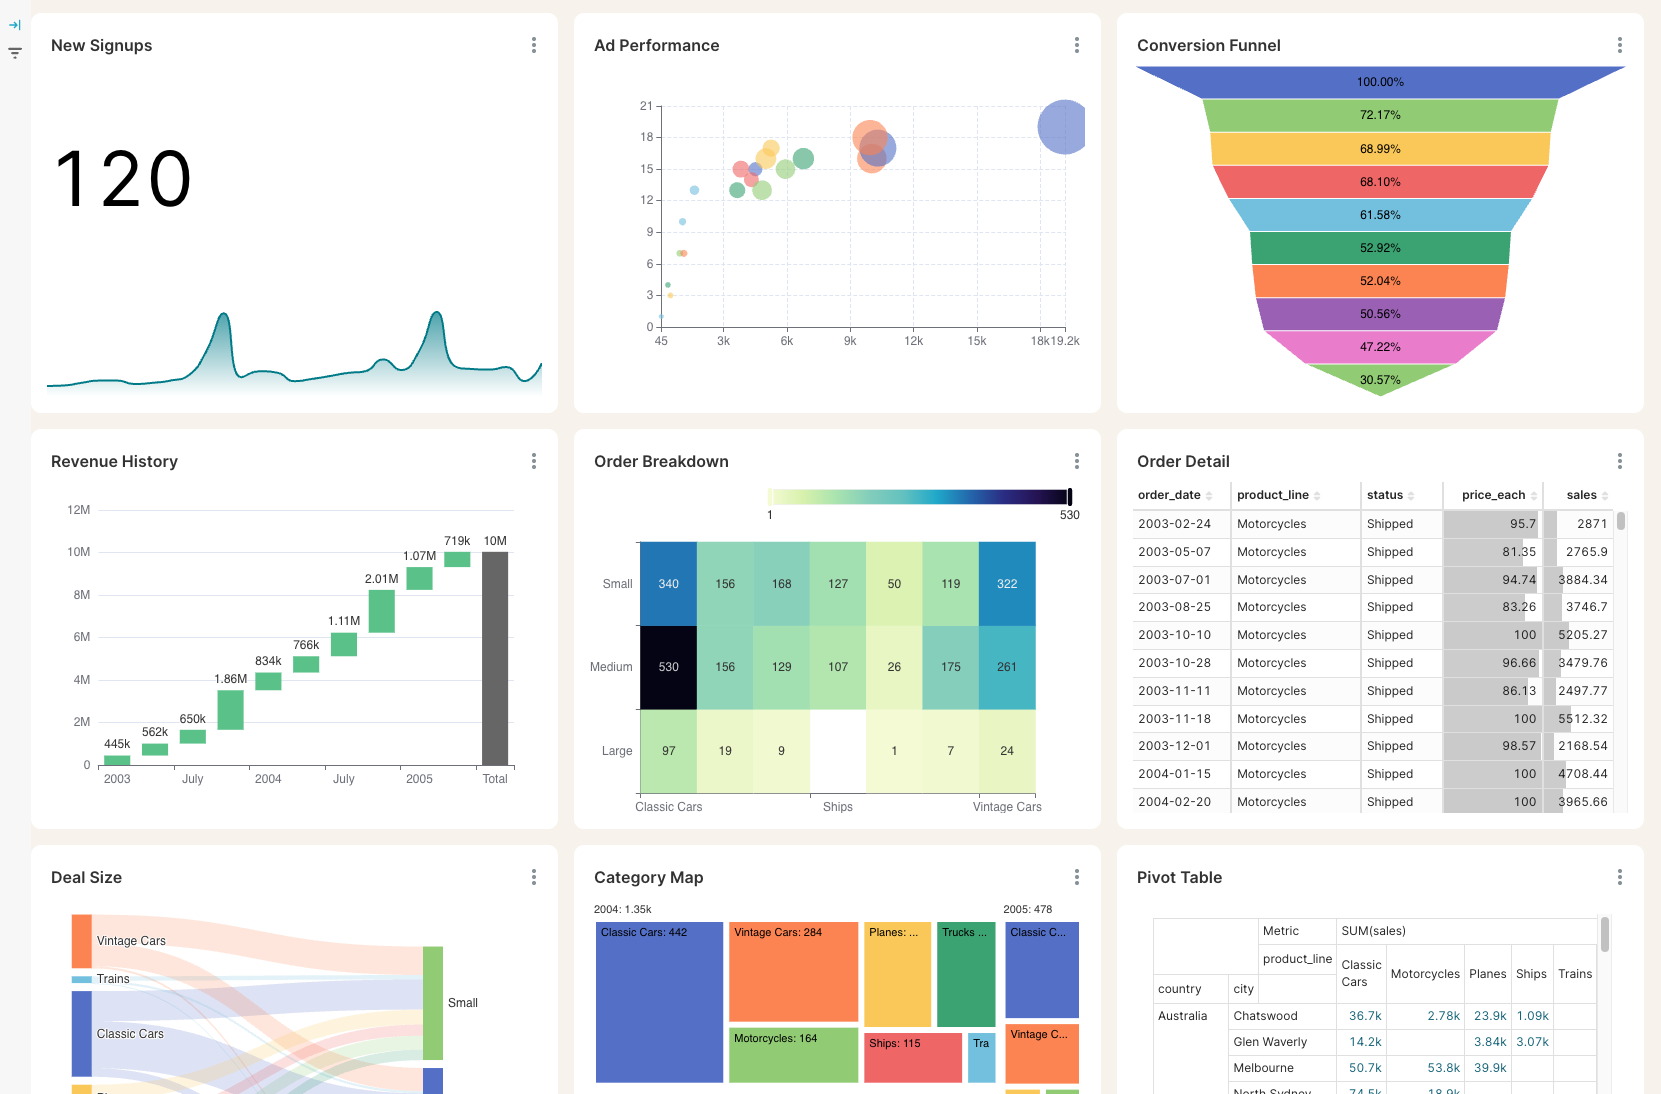
Your live custom reporting dashboards instantly surface which products, customers, or campaigns are losing money.
-
Prioritize with confidence
Understand which tasks will make the biggest impact so you invest limited time and cash where it matters most.
-

Protect your margins
Not just your sales. Pinpoint where costs are rising and instantly see what you can control.
-
Stop guessing and start leading
Navigate the unknowns and make bold decisions with data, not just gut feel.
-
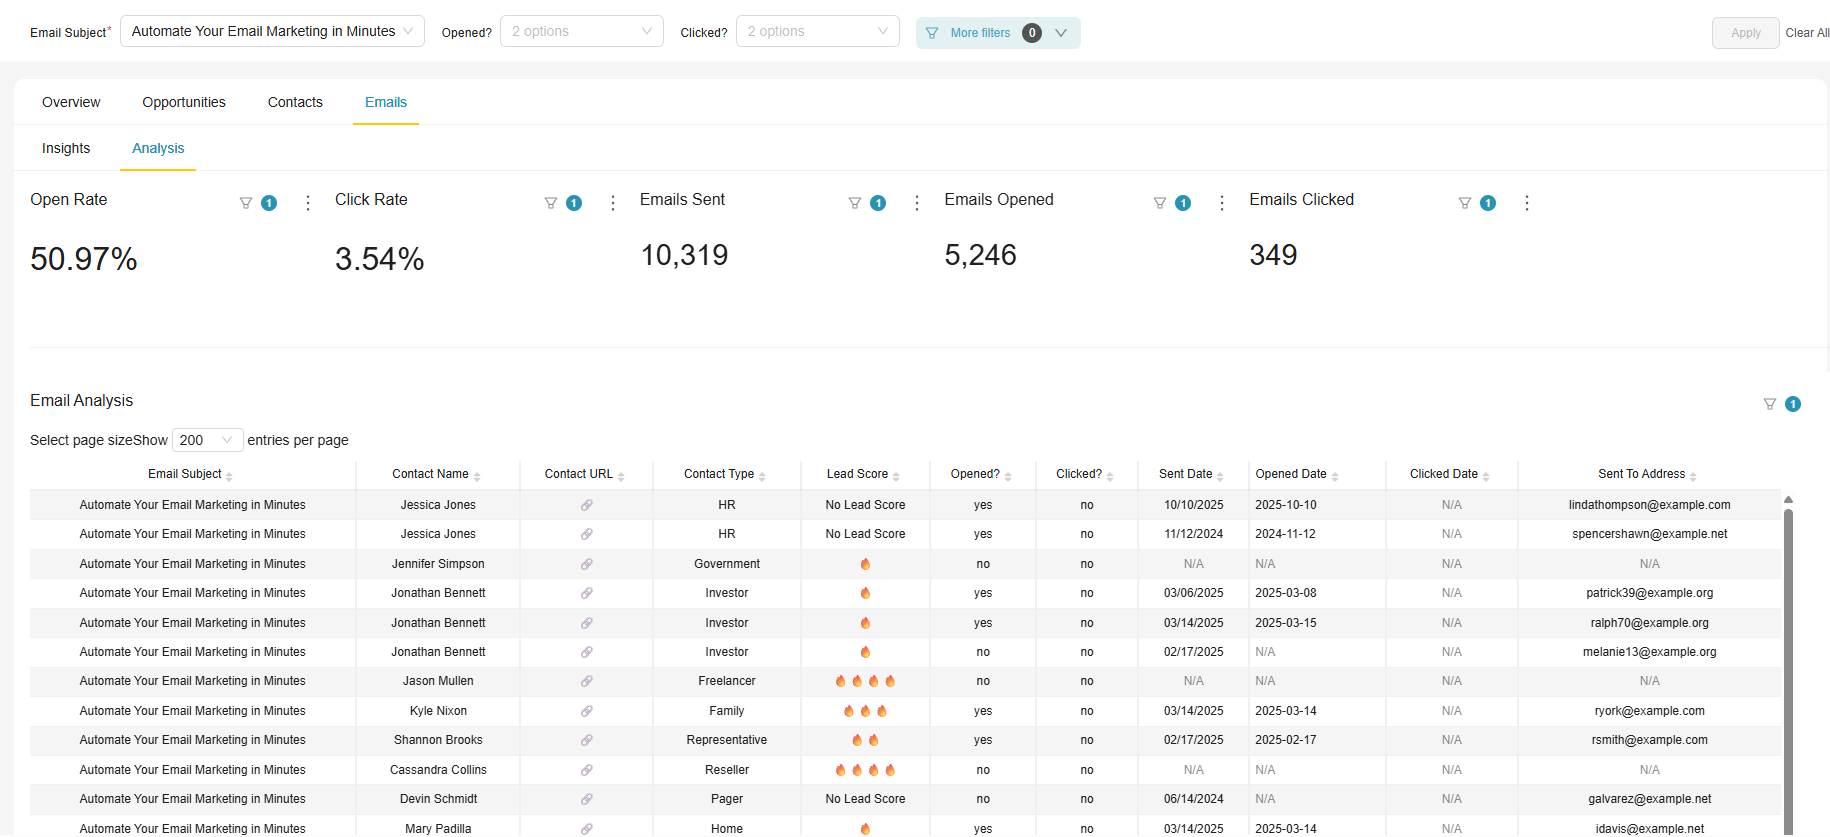
Chart a clear plan
even when resources are tight and markets shift.
-
Receive proactive, personalized guidance
from your BlinkMetrics team: trusted experts who turn your data into clear steps forward.
Clarity that leads to real insight, real action, and real results
You built your business to thrive, not just survive. BlinkMetrics leads you from uncertainty to confidence so you can make strategic moves that pay off.
- “We spotted $15,000 in overhead we didn’t even know was there.”
- “Just one dashboard showed what needed fixing and what was already working.”
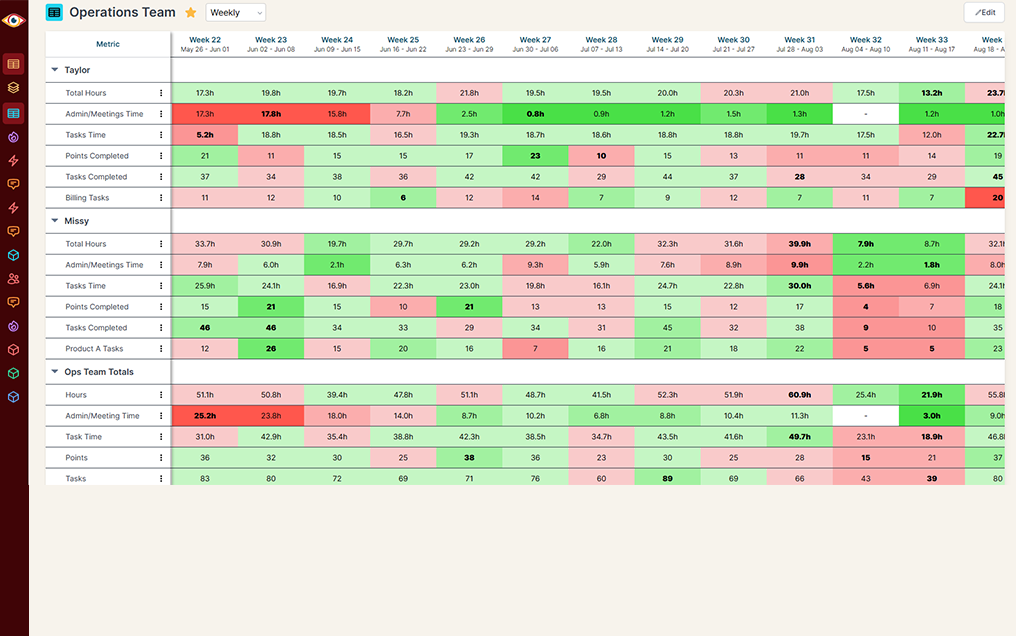
- “We cut our manual reporting time by 75% and focused those hours on key projects instead.”
-
“My worst enemy was my brain. With these reports and dashboards, I can step away for a few days while someone else reviews orders and makes smart decisions based on the data.”
Jesse Nelson Founder, DiabolikDVD
-
“This is an asset for the business that gives us data analysis across millions and millions of data points.”
Erik Jensen Chief Strategy Officer, PredictiveROI
-
“For the first time, we can look at gross, fees, transfers — in a logical way that ties penny to penny with our general ledger.”
Bob Arnold CFO, Nolodex
Success stories & case studies
See how businesses like yours have grown and thrived with the help of BlinkMetrics.
-

How High Growth boosts growth with automated reporting over manual spreadsheets
“Having a product where we can just say, ‘This is the system we use for this level of reporting,’ makes things much cleaner. Now we can deliver high-quality client-facing reporting with the rest of our service package.”
read the full story -

How Kids2Dentist turned QuickBooks data into founder-friendly financial storytelling
“I was worried I was going to have to do it myself. So, having you build us a custom reporting dashboard is perfect, and it’ll auto-update!”
read the full story -
From Blind Spots to Boardroom Ready, Nolodex’s Stripe Reporting Transformation
“We looked at other popular tools. We looked at building it ourselves. Nothing compared to what BlinkMetrics delivered.”
read the full story -

How DiabolikDVD Unlocked New Revenue With Custom WooCommerce Inventory Reports
“This is a wealth of data for me. I can’t ask for more than this. I’m ordering the right products at the right time (no more missed sales), and returning what’s not working for a credit.”
read the full story -

How PredictiveROI Transformed Their Data Into a Powerful Business Asset
“This is an asset for the business that gives us data analysis across millions and millions of data points.”
read the full story
Real concerns, straight answers
Here’s how BlinkMetrics handles the real risks you’re weighing: capacity, cash, and confidence.
-
We’re already behind and overwhelmed. Do we really have capacity for this?
BlinkMetrics is meant to reduce your load, not add to it. Setup and data work are handled for you.
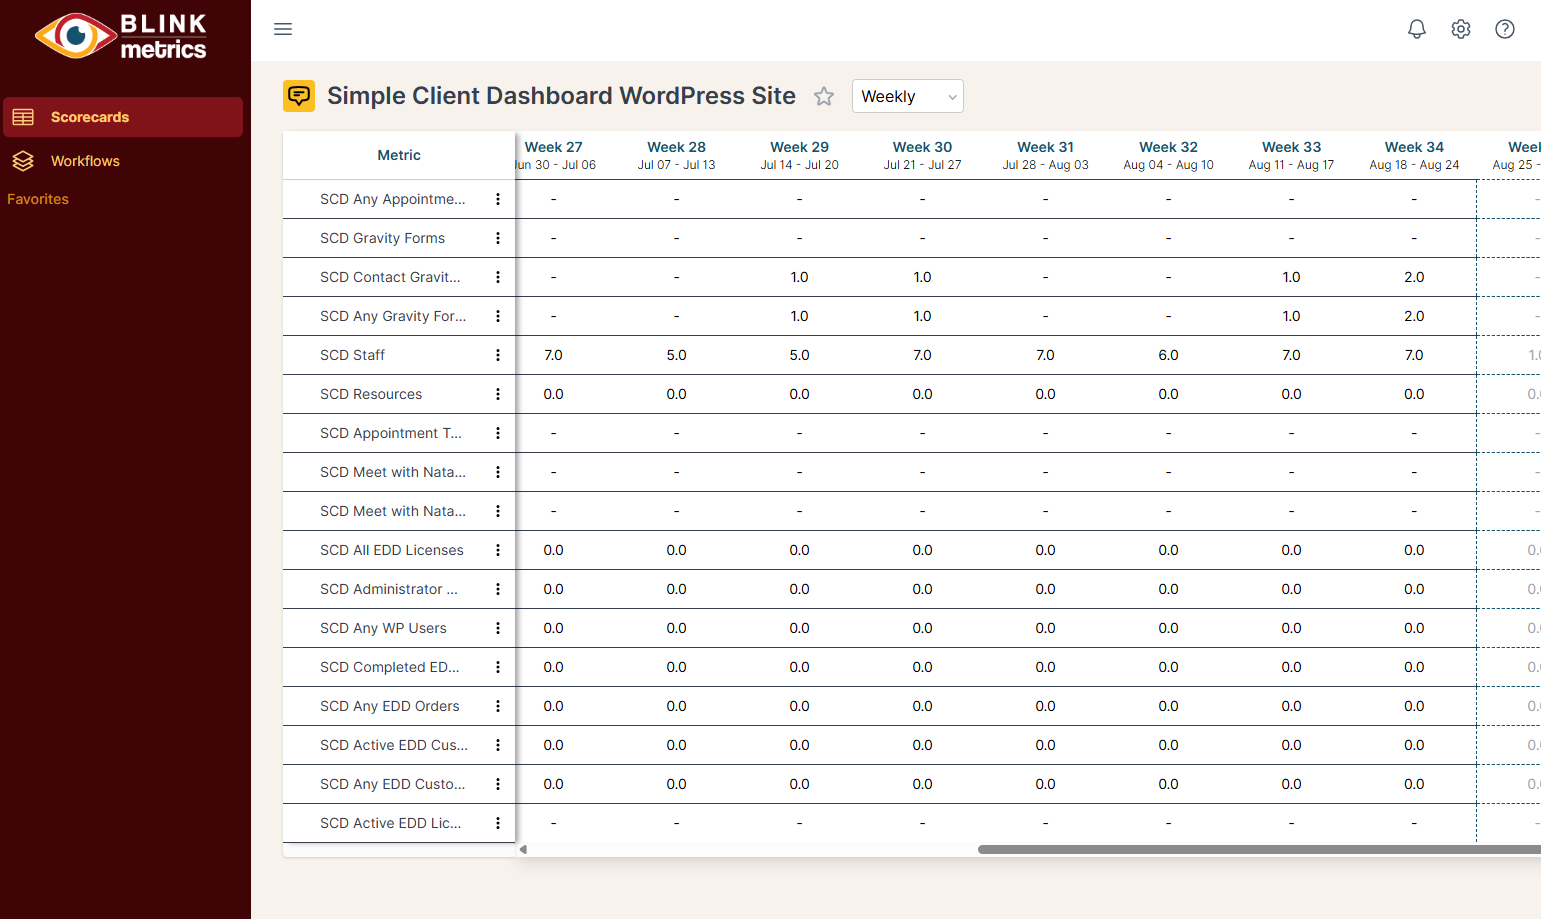
The end result is a focused custom dashboard you can check quickly to see:
- What’s urgent.
- What can wait.
- Where to prioritize efforts for biggest impact.
-
With money tight, how does this translate into real financial impact?
The work is oriented around finding and prioritizing profit and cash-flow leaks:
- Unprofitable offers.
- Wasted ad spend.
- Costly customers.
- Operational waste.
That way you can make a few focused changes that move numbers that matter, not just vanity metrics.
-
We’ve been burned by vague ‘insight’ tools before. What’s different about BlinkMetrics?
Instead of generic “optimize performance” language, each insight is tied to specific metrics (e.g. margin by client, channel ROAS, utilization) and accompanied by concrete suggestions you can test and verify in your own books.
-
How long before we see anything we can actually use?
Your business health dashboard will be live in less than 30 days from connecting your business tools. In most cases, you’ll get a first “where the leaks probably are” picture within weeks.
-
Most days I feel like I’m carrying all this alone and second-guessing every decision. Will BlinkMetrics actually give me what I need to make decisions without wondering if I’m missing something or doubting my next step?
Absolutely. Running a business can feel isolating, especially when every decision seems urgent and the risks feel personal. With BlinkMetrics, you don’t have to carry all the weight alone.
You get not just dashboards, but a strategy partner who helps you interpret what you’re seeing so you can move forward with genuine clarity, making tough calls with numbers-backed confidence.