Skip to content

HighLevel gives you reports. BlinkMetrics gives you clarity.

Stop wasting time pulling numbers. BlinkMetrics turns your GoHighLevel data into live insights that guide growth.

book a discovery call
GoHighLevel

See BlinkMetrics in action

Go beyond generic reports — watch how our GoHighLevel integration uncovers hidden insights and delivers the clarity your team has been missing across pipeline, sources, agent activity, and revenue.

book demo
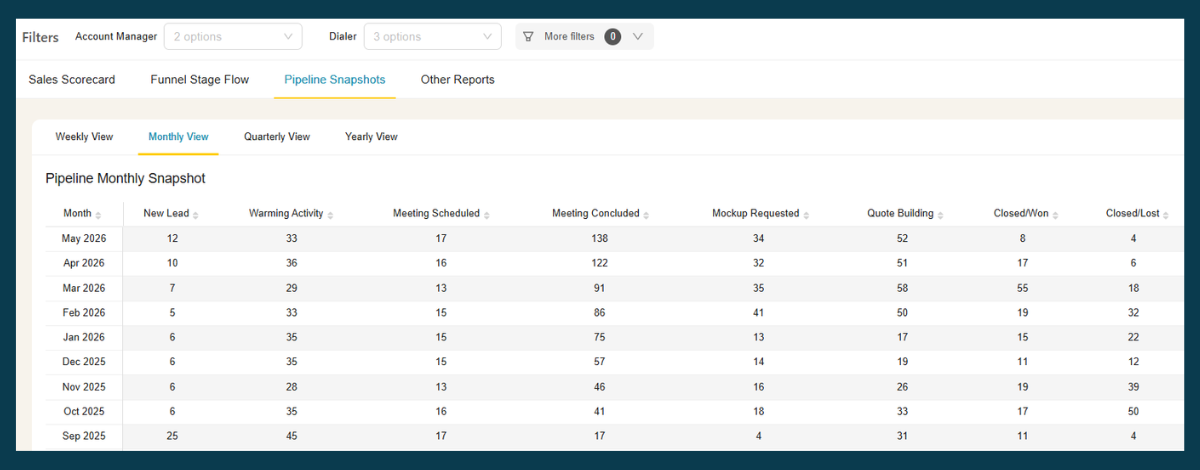
  • GoHighLevel pipeline monthly snapshot showing deal stage counts across reps and months
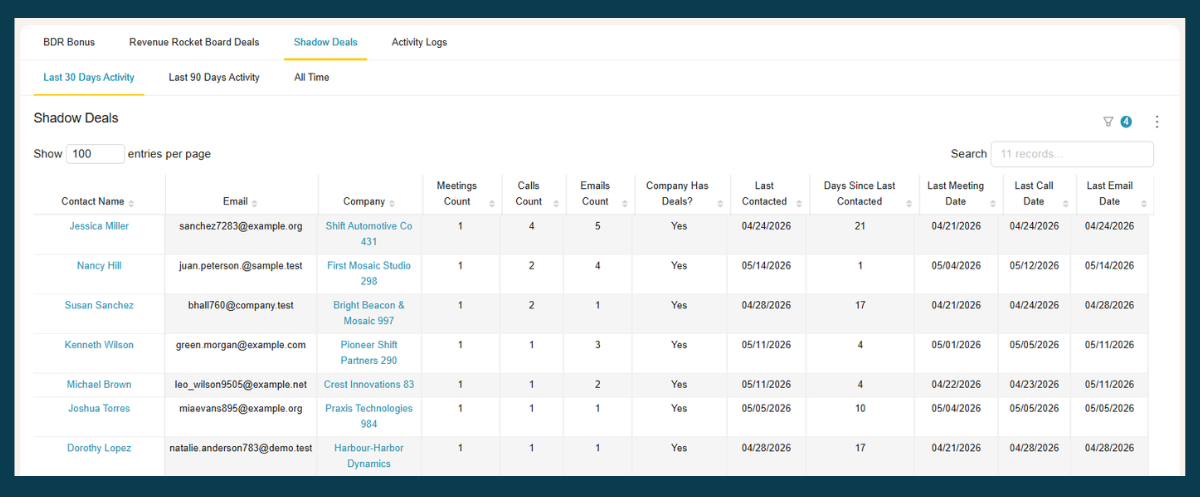
  • GoHighLevel shadow deals report listing contacts with sales activity but no associated deal
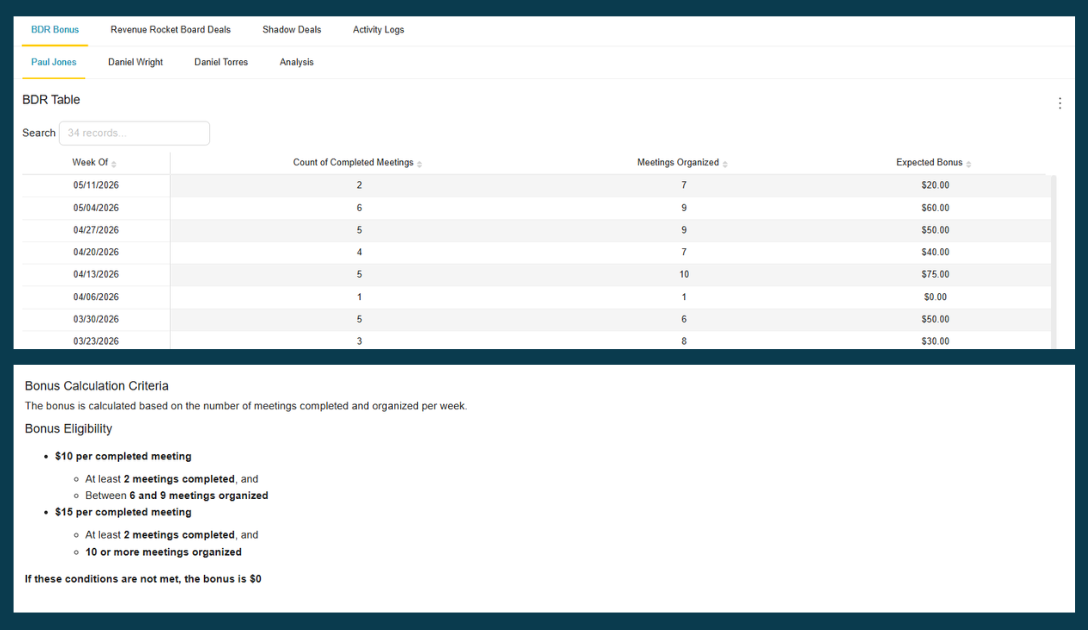
  • GoHighLevel BDR bonus dashboard calculating weekly meeting-based bonuses from agent activity
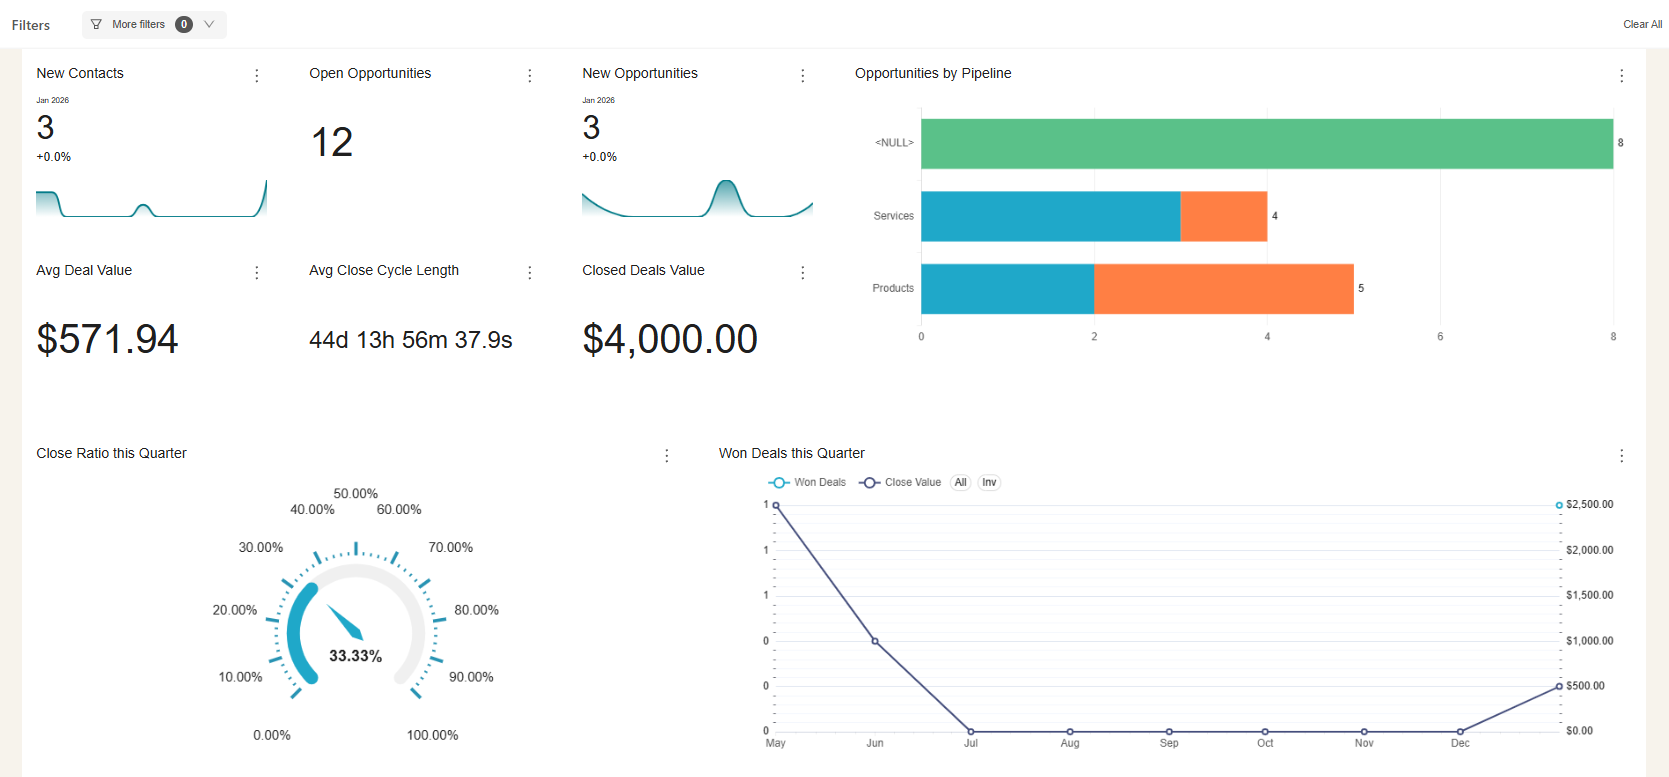
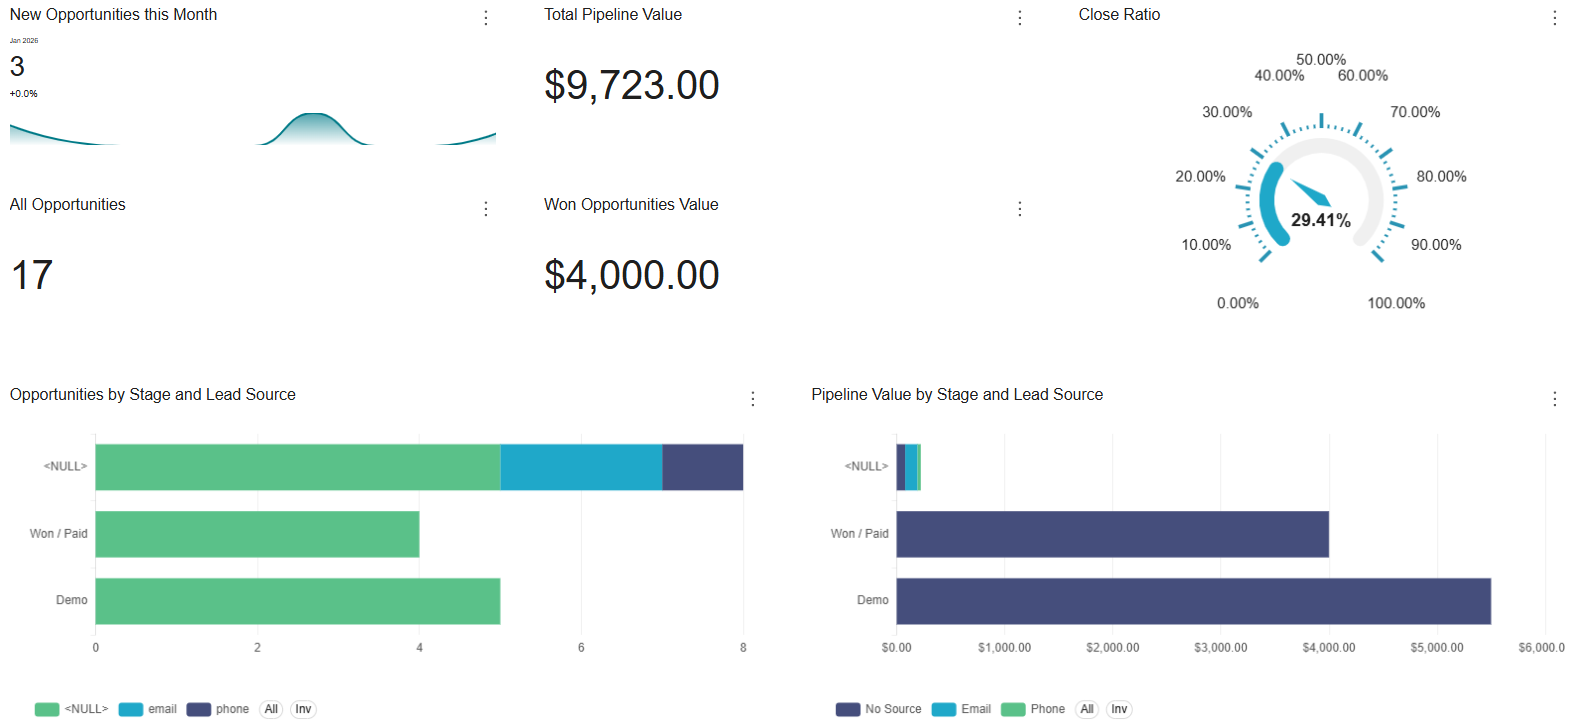
  • GoHighLevel opportunity and revenue analytics dashboard
  • GoHighLevel lead source and funnel performance dashboard
  • GoHighLevel sales pipeline visibility dashboard
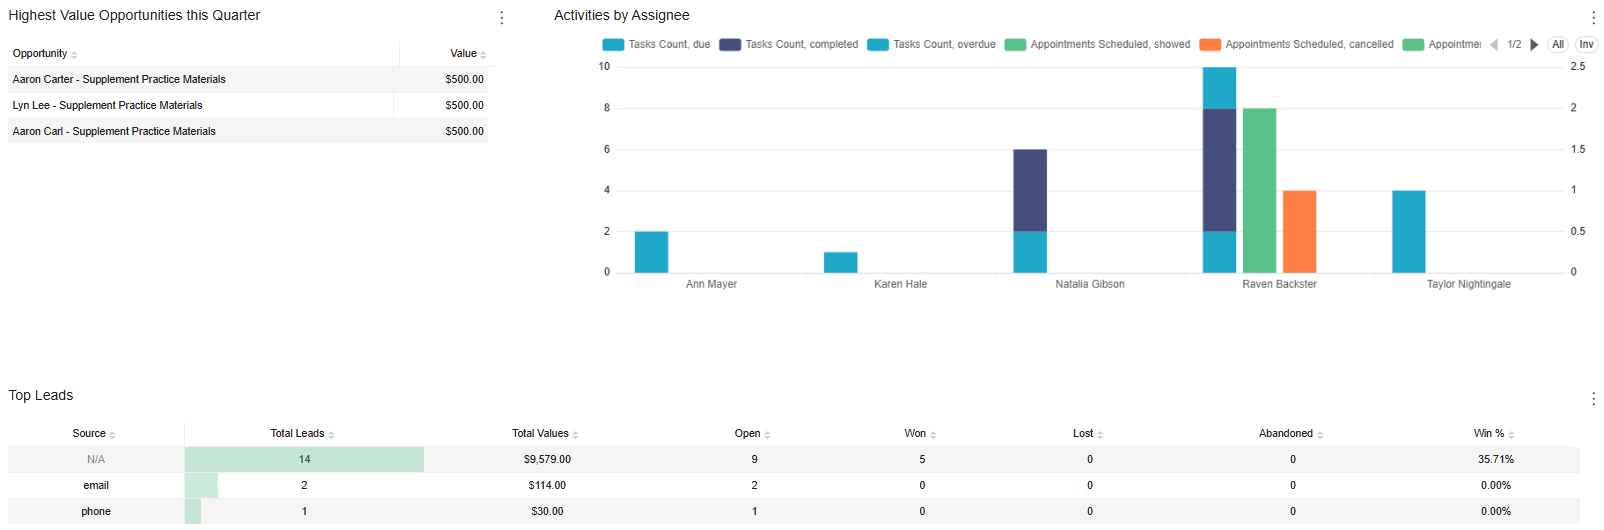
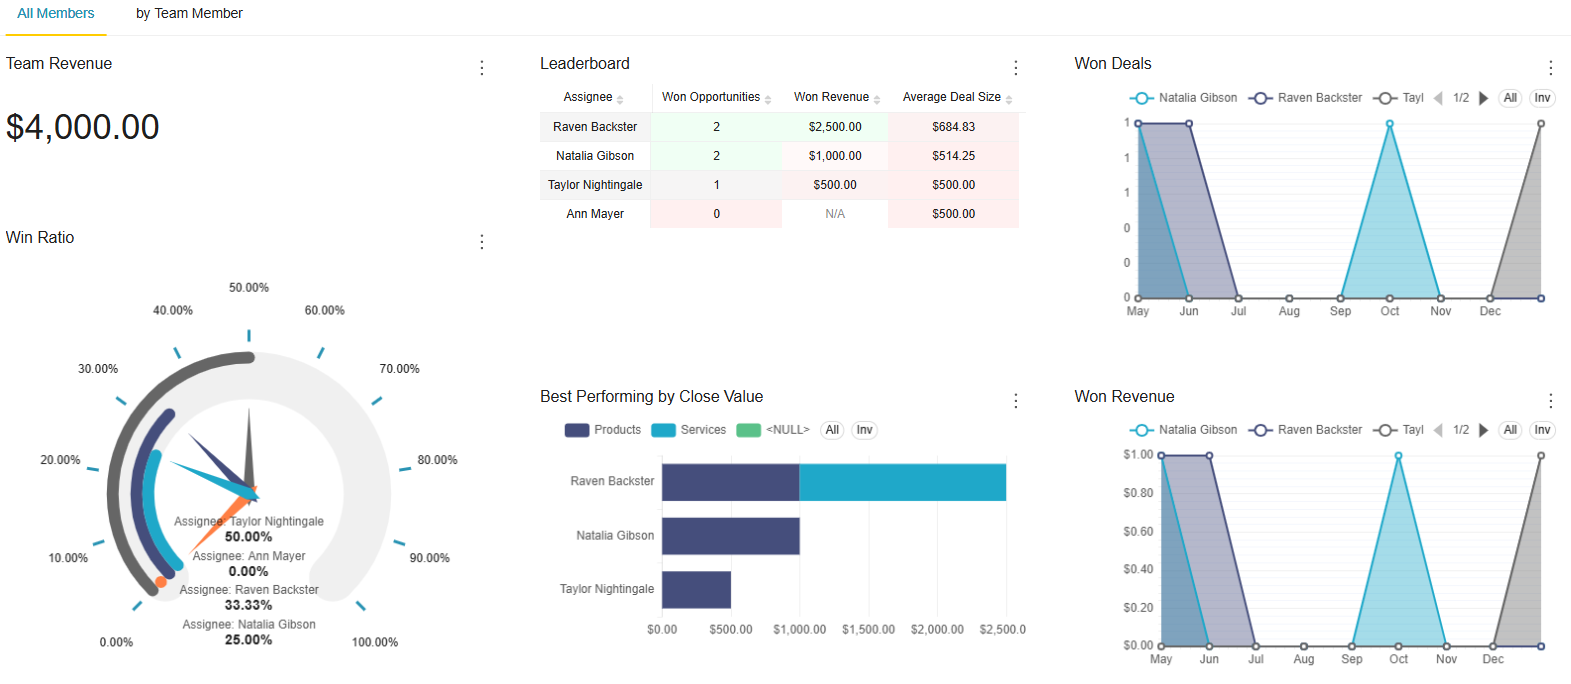
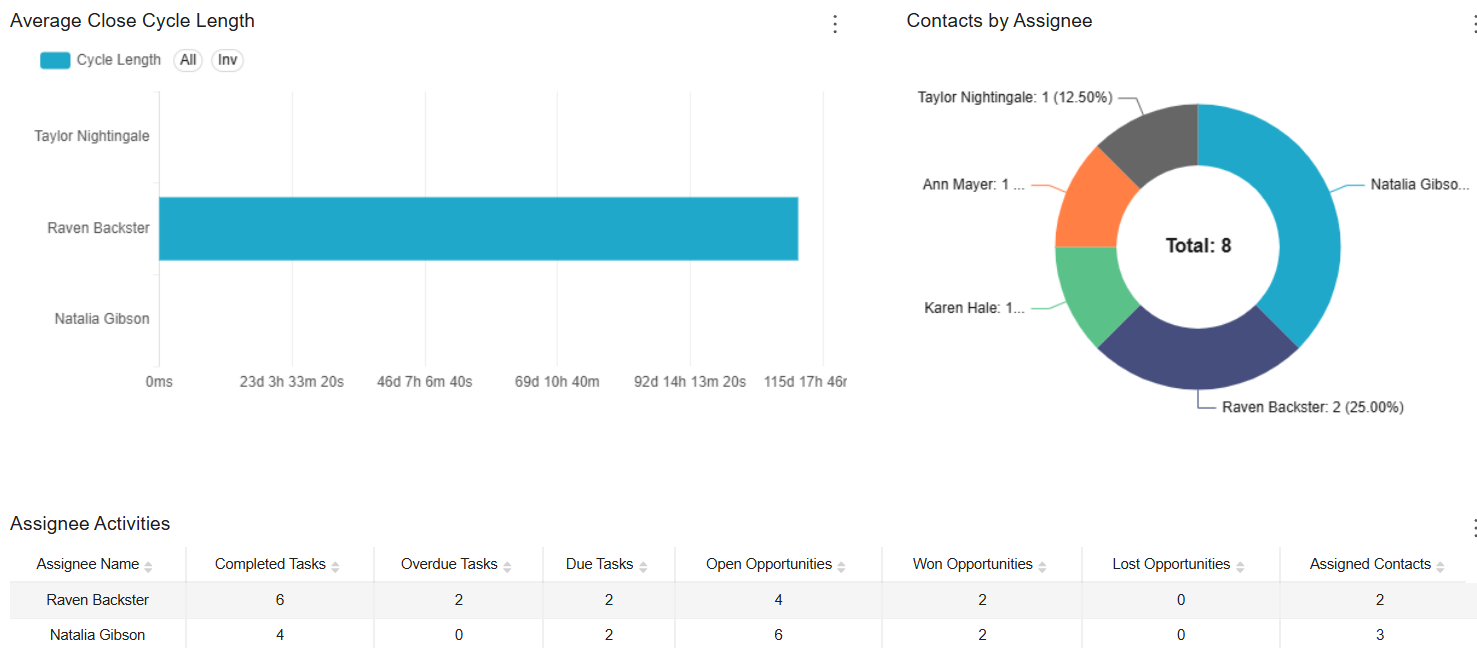
  • GoHighLevel sales team performance and activity dashboard
  • GoHighLevel contact, activity, and deal intelligence dashboard

Spreadsheets get you close, but they won't get you all the way

  • Endless CSV Exports
  • Hours to find an answer
  • Broken links, Zaps & formulas
  • Numbers are difficult to verify
  • Everything breaking as you scale

RIP spreadsheets. BlinkMetrics brings your reporting into live dashboards that show what's really happening in your business.

Easily connect to any business tool

We capture raw data from any platform and keep it updated continuously. You'll always have the live numbers, full history, and ability to drill into any KPI for the details that explain it.
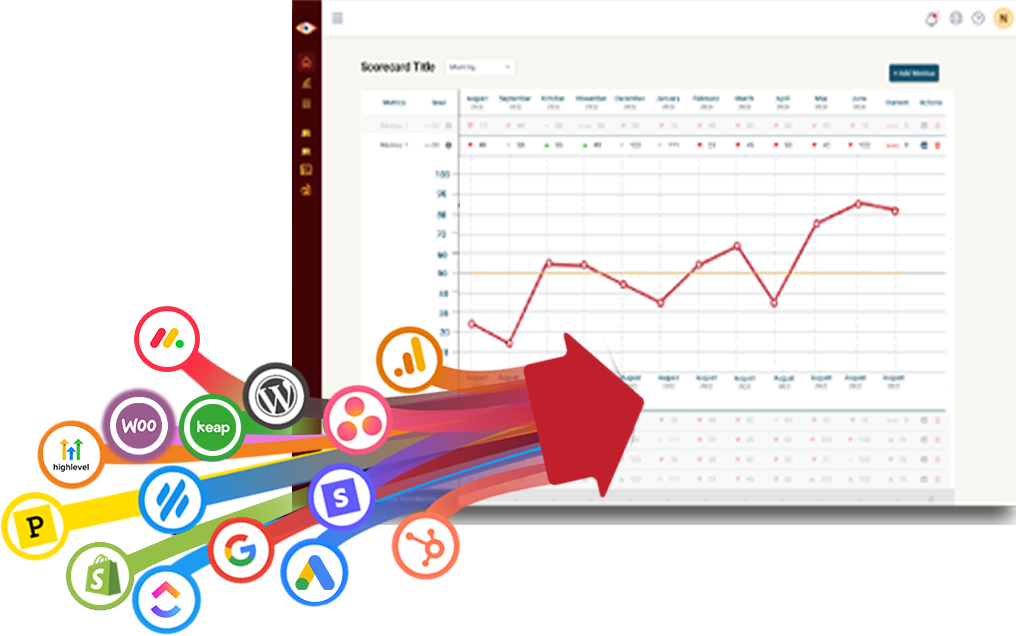
BlinkMetrics scorecard with callout boxes

Get the reporting you never could before

Access custom reports with interactive dashboards & scorecards, giving you answers to questions you've never been able to answer easily. Look deeper into any number, explore trends, and slice & dice results by any segment.
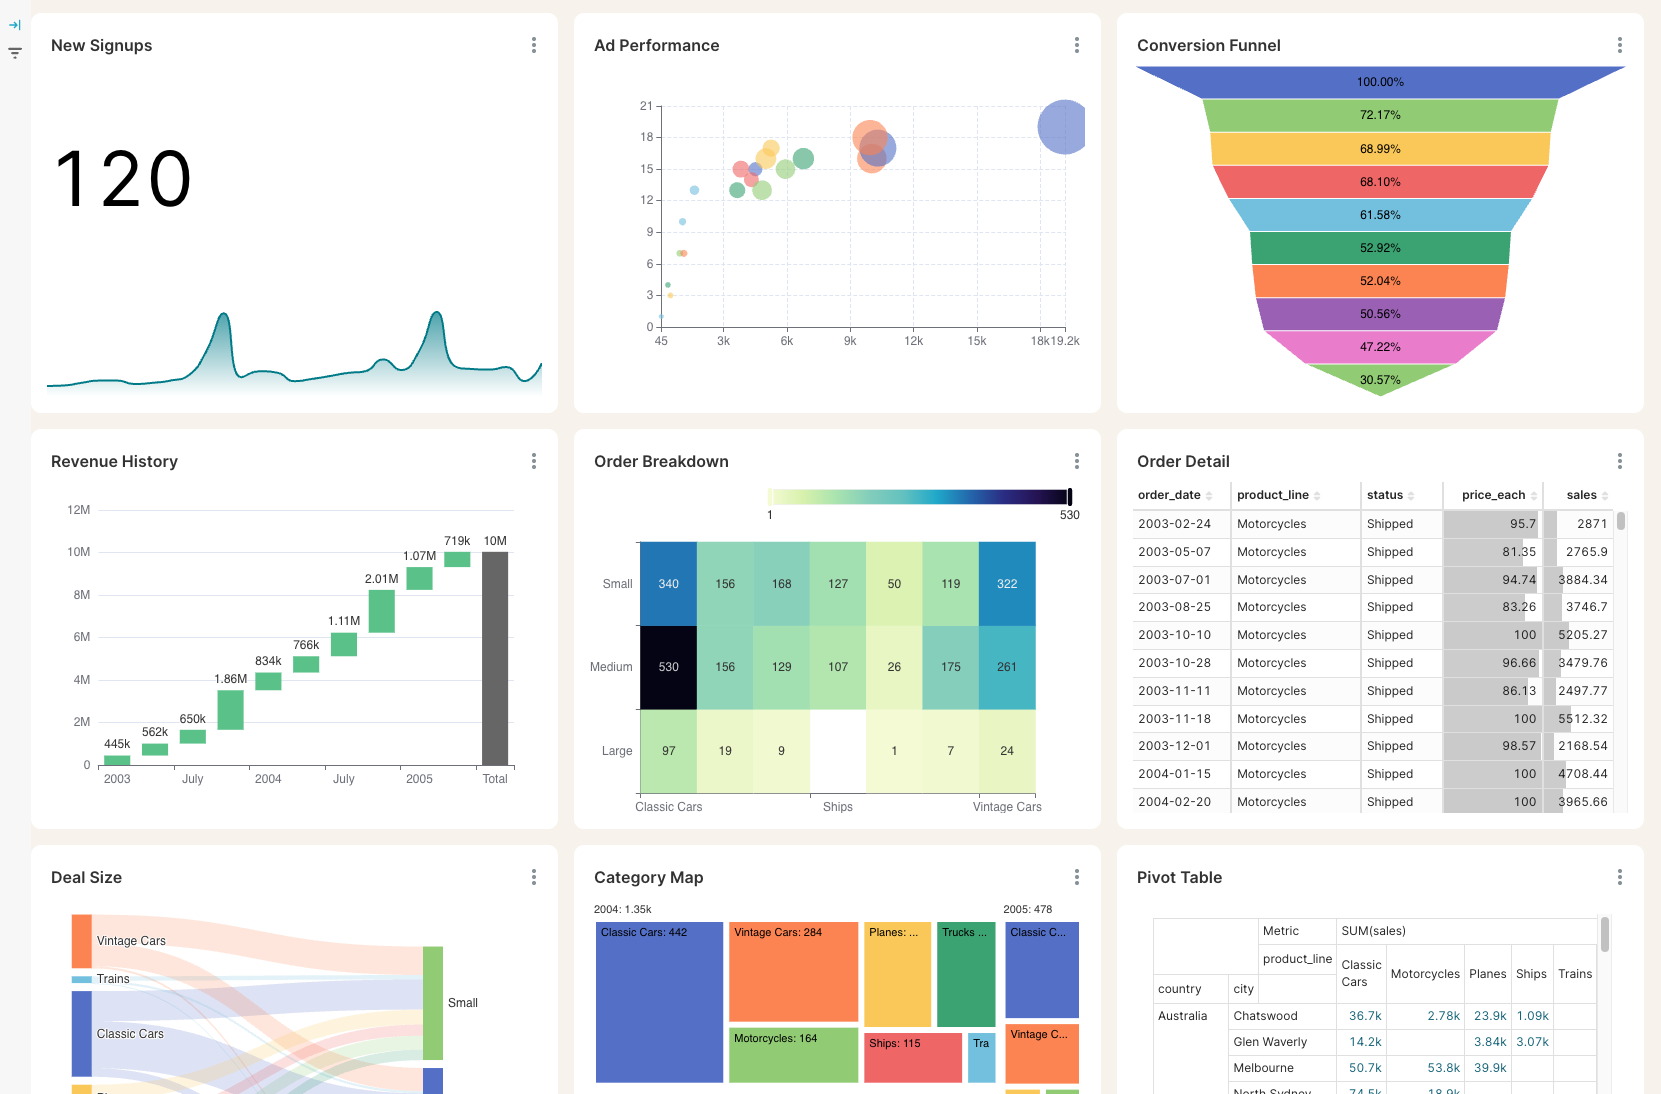
Advanced custom reporting dashboards

Stay on track with real time visibility & alerts

Set clear goals, track progress in real time, and get alerts the moment a KPI slips or beats target. Acting proactively & not reactively means you're no longer the last to know.
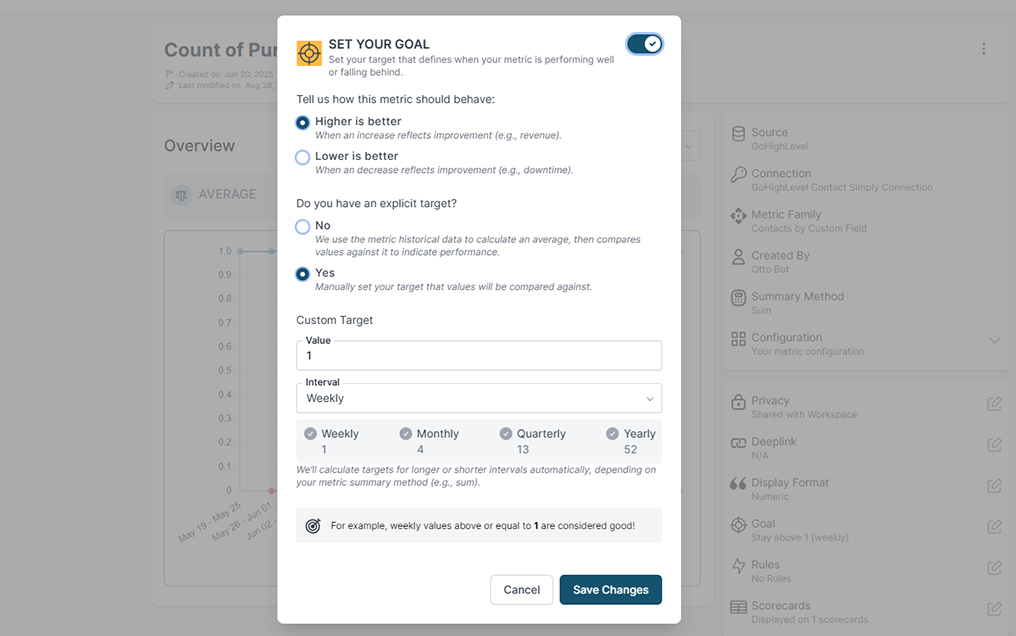
Goal setting and real-time alerts

Keep your team in the loop and accountable

Keep goals front and center with reports designed for each person, team, or location — shared in real time to keep performance transparent and encourage accountability.
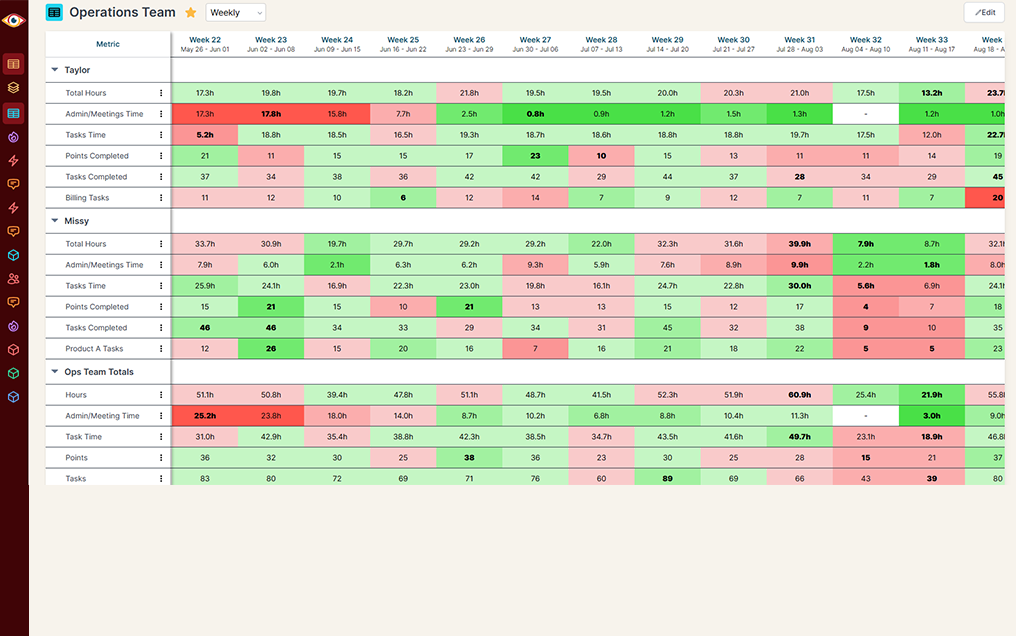
Operations scorecard for team accountability

The blind spots holding your growth back

GoHighLevel gives you a start, but critical insights are missing — from churn and customer history to attribution, agent performance, and historical trends. BlinkMetrics fills every gap.

GoHighLevel alone GoHighLevel + BlinkMetrics
Reporting Visibility
  • Surface-Level Reports. GoHighLevel shows the basics but leaves out insights like opportunities by person, making it hard to understand performance and make smarter decisions.
  • Deep Dashboards. Surfaces the views GoHighLevel hides — opportunities by person, segment, and source — so you actually understand what's driving performance.
Historical Reporting
  • Real-Time Only. GoHighLevel reports real-time data, but there is no visibility into last month or last quarter analytics to track trends over time.
  • Daily Snapshots. Captures daily snapshots of your GoHighLevel data, providing a true historical view so you can chart trends across weeks, months, and years.
Multi-Source Dashboards
  • Data Scattered Across Tools. Managing metrics across multiple platforms wastes time, creates confusion, and leaves you guessing instead of acting with confidence.
  • One Unified View. Pulls GoHighLevel alongside QuickBooks, Stripe, GA, ad platforms, and 100+ other sources into a single dashboard your whole team can rely on.
KPI Visibility
  • KPIs Buried Everywhere. Important numbers are buried across different dashboards, making it frustrating to monitor progress and slowing down growth decisions.
  • KPIs At A Glance. Headline metrics, scorecards, and trends sit on a single live dashboard so leaders see the whole business in one view.
Agent And Team Performance
  • Hard To Track Agents. GoHighLevel makes it difficult to break down results by role or team member, leaving managers guessing who's driving results.
  • Rep Scorecards. Clear opportunities-by-agent reports with calls, meetings, and deals won — built automatically, not manually compiled from scattered reports.
Funnel And Pipeline Insights
  • No Funnel View. Tracking lead progression through pipeline stages isn't possible natively, so you can't tell where leads stall or drop off.
  • Flexible Funnel Reporting. Multi-step funnel visualization that shows where leads drop off and why — from first touch through opportunity, demo, and close.
Attribution And Source Tracking
  • Surface-Level Sources. GoHighLevel native reports stop at surface-level data, leaving you blind to the path each lead actually took.
  • Multi-Touch Attribution. Stitches every step a lead took before becoming a customer — source, campaign, touchpoint, rep — so you know which efforts grow revenue.
Custom KPIs And Metrics
  • Rigid Built-In Metrics. The built-in metrics are fixed, leaving no room for custom KPIs like segment ROI, campaign ROI, or cost per demo.
  • Define Your Own KPIs. Build the metrics that matter to your business — CLV, ROAS by campaign, cost per demo, close rate by source — sourced from GoHighLevel and any connected system.
Global Filters Across The Dashboard
  • Per-Widget Filters. Each GoHighLevel report applies its own filter. Switching a date range or campaign view forces you to update every chart individually.
  • One-Click Global Filters. A single date, campaign, source, or agent filter applies across every widget on the dashboard so the whole view moves together.

GoHighLevel alone

Reporting Visibility

  • Surface-Level Reports. GoHighLevel shows the basics but leaves out insights like opportunities by person, making it hard to understand performance and make smarter decisions.

Historical Reporting

  • Real-Time Only. GoHighLevel reports real-time data, but there is no visibility into last month or last quarter analytics to track trends over time.

Multi-Source Dashboards

  • Data Scattered Across Tools. Managing metrics across multiple platforms wastes time, creates confusion, and leaves you guessing instead of acting with confidence.

KPI Visibility

  • KPIs Buried Everywhere. Important numbers are buried across different dashboards, making it frustrating to monitor progress and slowing down growth decisions.

Agent And Team Performance

  • Hard To Track Agents. GoHighLevel makes it difficult to break down results by role or team member, leaving managers guessing who's driving results.

Funnel And Pipeline Insights

  • No Funnel View. Tracking lead progression through pipeline stages isn't possible natively, so you can't tell where leads stall or drop off.

Attribution And Source Tracking

  • Surface-Level Sources. GoHighLevel native reports stop at surface-level data, leaving you blind to the path each lead actually took.

Custom KPIs And Metrics

  • Rigid Built-In Metrics. The built-in metrics are fixed, leaving no room for custom KPIs like segment ROI, campaign ROI, or cost per demo.

Global Filters Across The Dashboard

  • Per-Widget Filters. Each GoHighLevel report applies its own filter. Switching a date range or campaign view forces you to update every chart individually.

GoHighLevel + BlinkMetrics

Reporting Visibility

  • Deep Dashboards. Surfaces the views GoHighLevel hides — opportunities by person, segment, and source — so you actually understand what's driving performance.

Historical Reporting

  • Daily Snapshots. Captures daily snapshots of your GoHighLevel data, providing a true historical view so you can chart trends across weeks, months, and years.

Multi-Source Dashboards

  • One Unified View. Pulls GoHighLevel alongside QuickBooks, Stripe, GA, ad platforms, and 100+ other sources into a single dashboard your whole team can rely on.

KPI Visibility

  • KPIs At A Glance. Headline metrics, scorecards, and trends sit on a single live dashboard so leaders see the whole business in one view.

Agent And Team Performance

  • Rep Scorecards. Clear opportunities-by-agent reports with calls, meetings, and deals won — built automatically, not manually compiled from scattered reports.

Funnel And Pipeline Insights

  • Flexible Funnel Reporting. Multi-step funnel visualization that shows where leads drop off and why — from first touch through opportunity, demo, and close.

Attribution And Source Tracking

  • Multi-Touch Attribution. Stitches every step a lead took before becoming a customer — source, campaign, touchpoint, rep — so you know which efforts grow revenue.

Custom KPIs And Metrics

  • Define Your Own KPIs. Build the metrics that matter to your business — CLV, ROAS by campaign, cost per demo, close rate by source — sourced from GoHighLevel and any connected system.

Global Filters Across The Dashboard

  • One-Click Global Filters. A single date, campaign, source, or agent filter applies across every widget on the dashboard so the whole view moves together.

Complete visibility in 30 days — we'll build you the ultimate GoHighLevel reporting dashboard

Easily see what's difficult or impossible to see in GoHighLevel

book a discovery call

Got questions? We've got answers

From setup to reporting, here are the most common questions agencies ask before getting started with BlinkMetrics for GoHighLevel.

  • How long does it take to set up BlinkMetrics with GoHighLevel?

    Setup is quick — most agencies connect their GoHighLevel account and start seeing dashboards within minutes. Our team then delivers your custom dashboard in 30 days or less. No complex tech skills required.

  • Do I need a developer to integrate BlinkMetrics?

    No. BlinkMetrics is built for non-technical teams. With just a few clicks — and our white-glove team handling the heavy lifting — your GoHighLevel data is consolidated and ready to use.

  • What type of insights will I see beyond GoHighLevel's reports?

    You'll get visibility into churn rates, customer history, campaign ROI, multi-touch attribution, agent performance, and cross-platform metrics that GoHighLevel alone doesn't provide.

  • Can I combine data from other tools besides GoHighLevel?

    Yes. BlinkMetrics supports multiple data sources, so you can view GoHighLevel metrics alongside data from QuickBooks, Stripe, GA, and 100+ other platforms in one unified dashboard.

  • Will my data stay secure?

    Absolutely. BlinkMetrics uses encrypted connections and industry-standard security protocols to keep your data safe and private.

  • Is there a trial or demo available?

    Yes. Book a free demo with our team to see exactly how BlinkMetrics works with your GoHighLevel setup.

Ready to do more with GoHighLevel?

Connect GoHighLevel and turn insights into action. We know where GoHighLevel's reporting falls short — historical trends, agent performance, attribution, custom KPIs — and we've built the dashboards that fill every gap.

book a call to see what's possible