Skip to content

Advanced Harvest reporting for businesses that push Harvest to its limits

Want to see which projects actually make money, who's billable, where time is leaking, and which clients are quietly slipping, without exporting everything to a spreadsheet? You know some of Harvest's frustrating reporting limitations. We fix them.

book a discovery call

See BlinkMetrics in action

Move beyond Harvest's surface-level reports. See how our integration uncovers project profitability, utilization, and budget clarity your business has been missing.

book demo
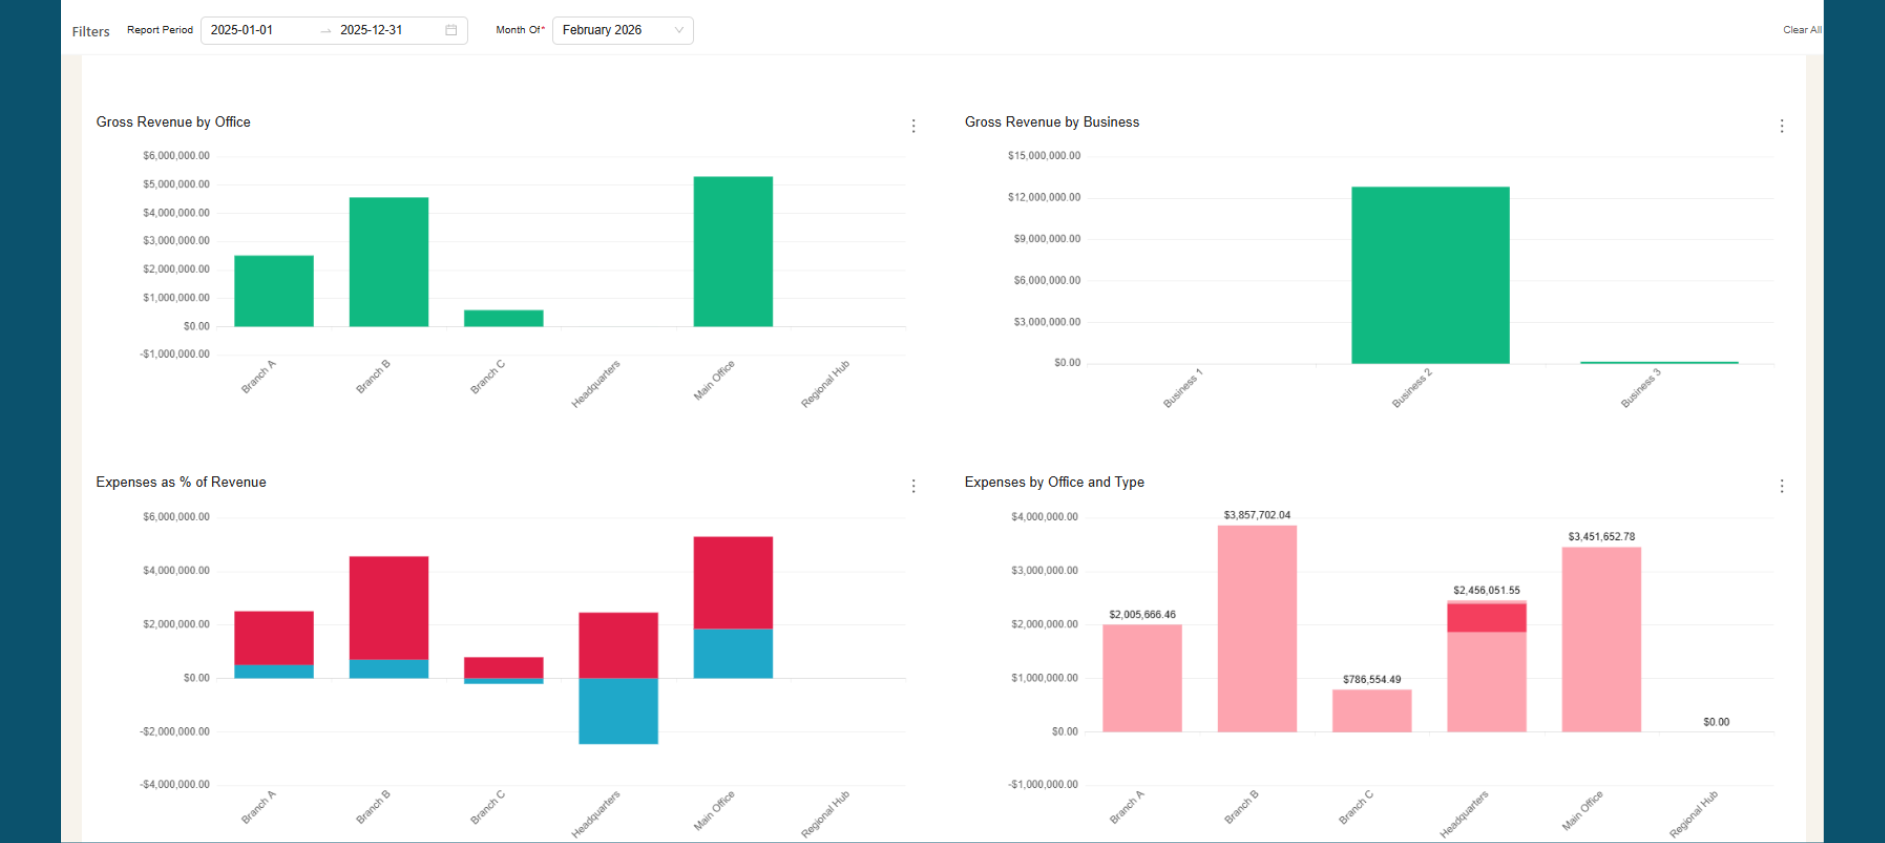
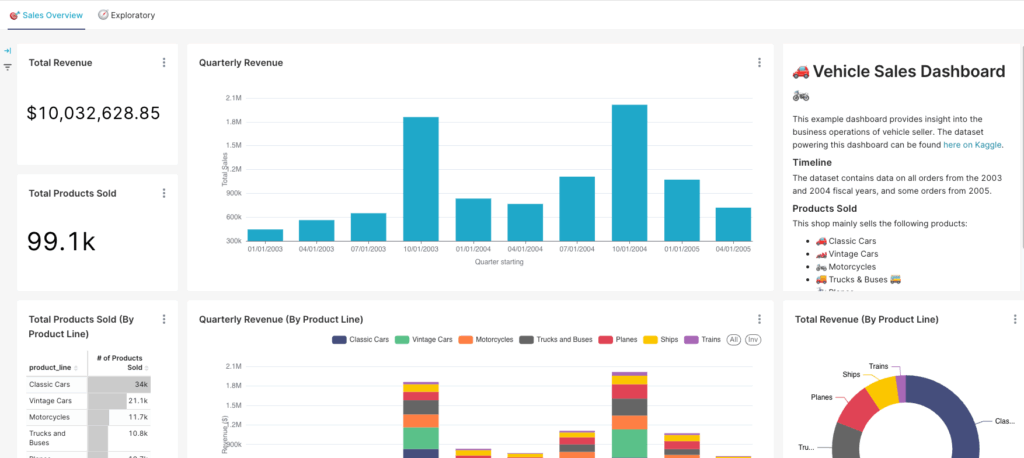
  • BlinkMetrics franchise revenue and expense reporting dashboard example
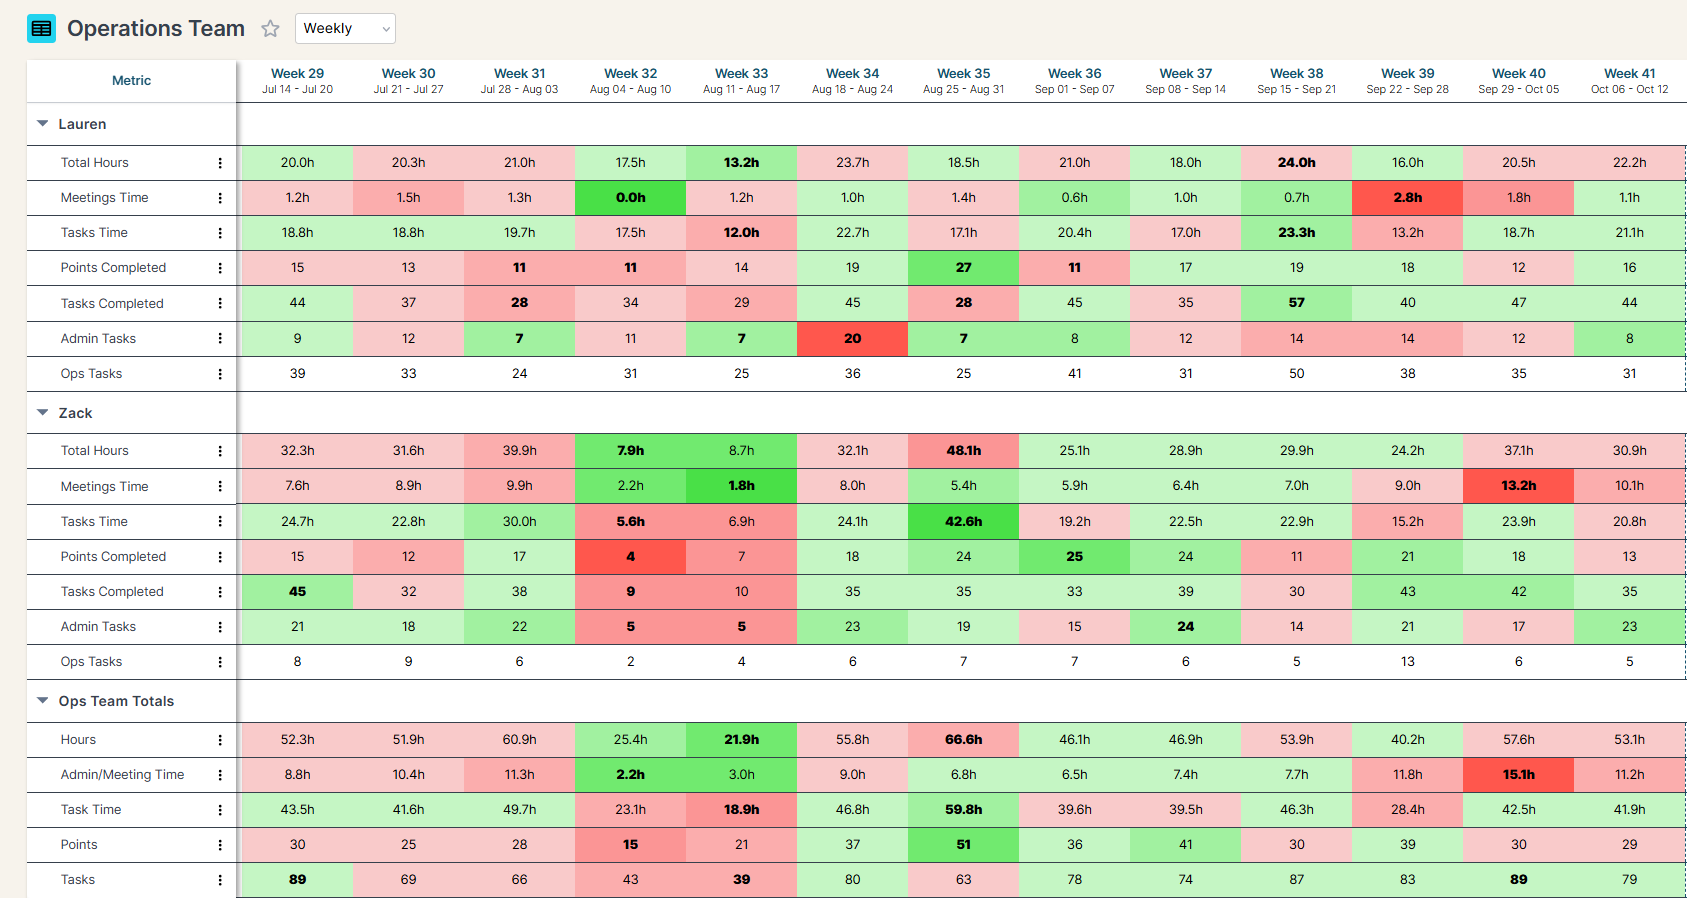
  • BlinkMetrics operations scorecard tracking team performance against goals
  • BlinkMetrics sales and marketing reporting dashboard example

Spreadsheets get you close, but they won't get you all the way

  • Endless CSV Exports
  • Hours to find an answer
  • Broken links, Zaps & formulas
  • Numbers are difficult to verify
  • Everything breaking as you scale

RIP spreadsheets. BlinkMetrics brings your reporting into live dashboards that show what's really happening in your business.

Easily connect to any business tool

We capture raw data from any platform and keep it updated continuously. You'll always have the live numbers, full history, and ability to drill into any KPI for the details that explain it.
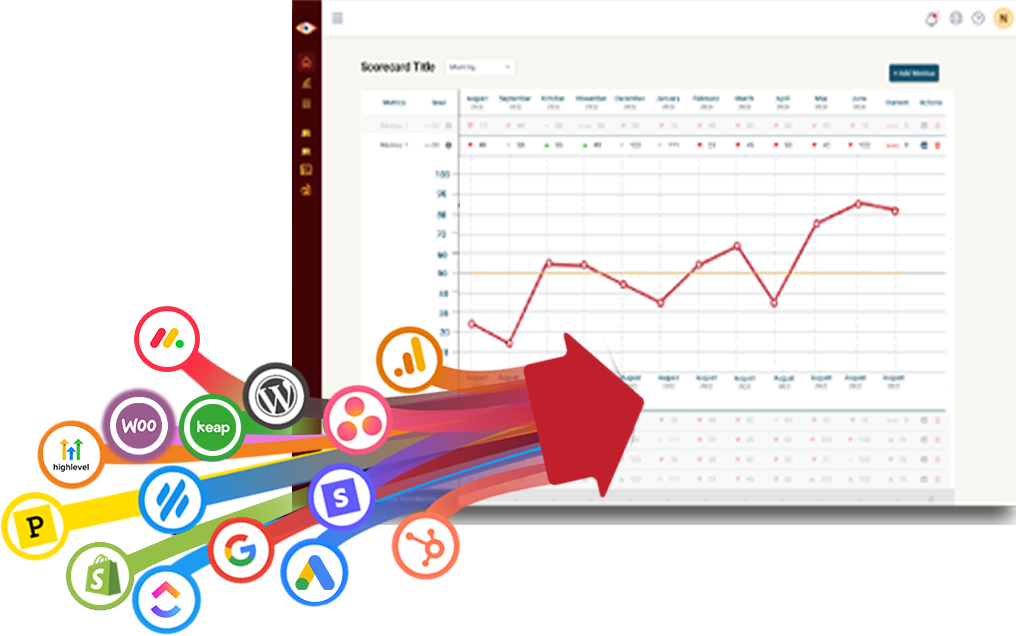
BlinkMetrics scorecard with callout boxes

Get the reporting you never could before

Access custom reports with interactive dashboards & scorecards, giving you answers to questions you've never been able to answer easily. Look deeper into any number, explore trends, and slice & dice results by any segment.
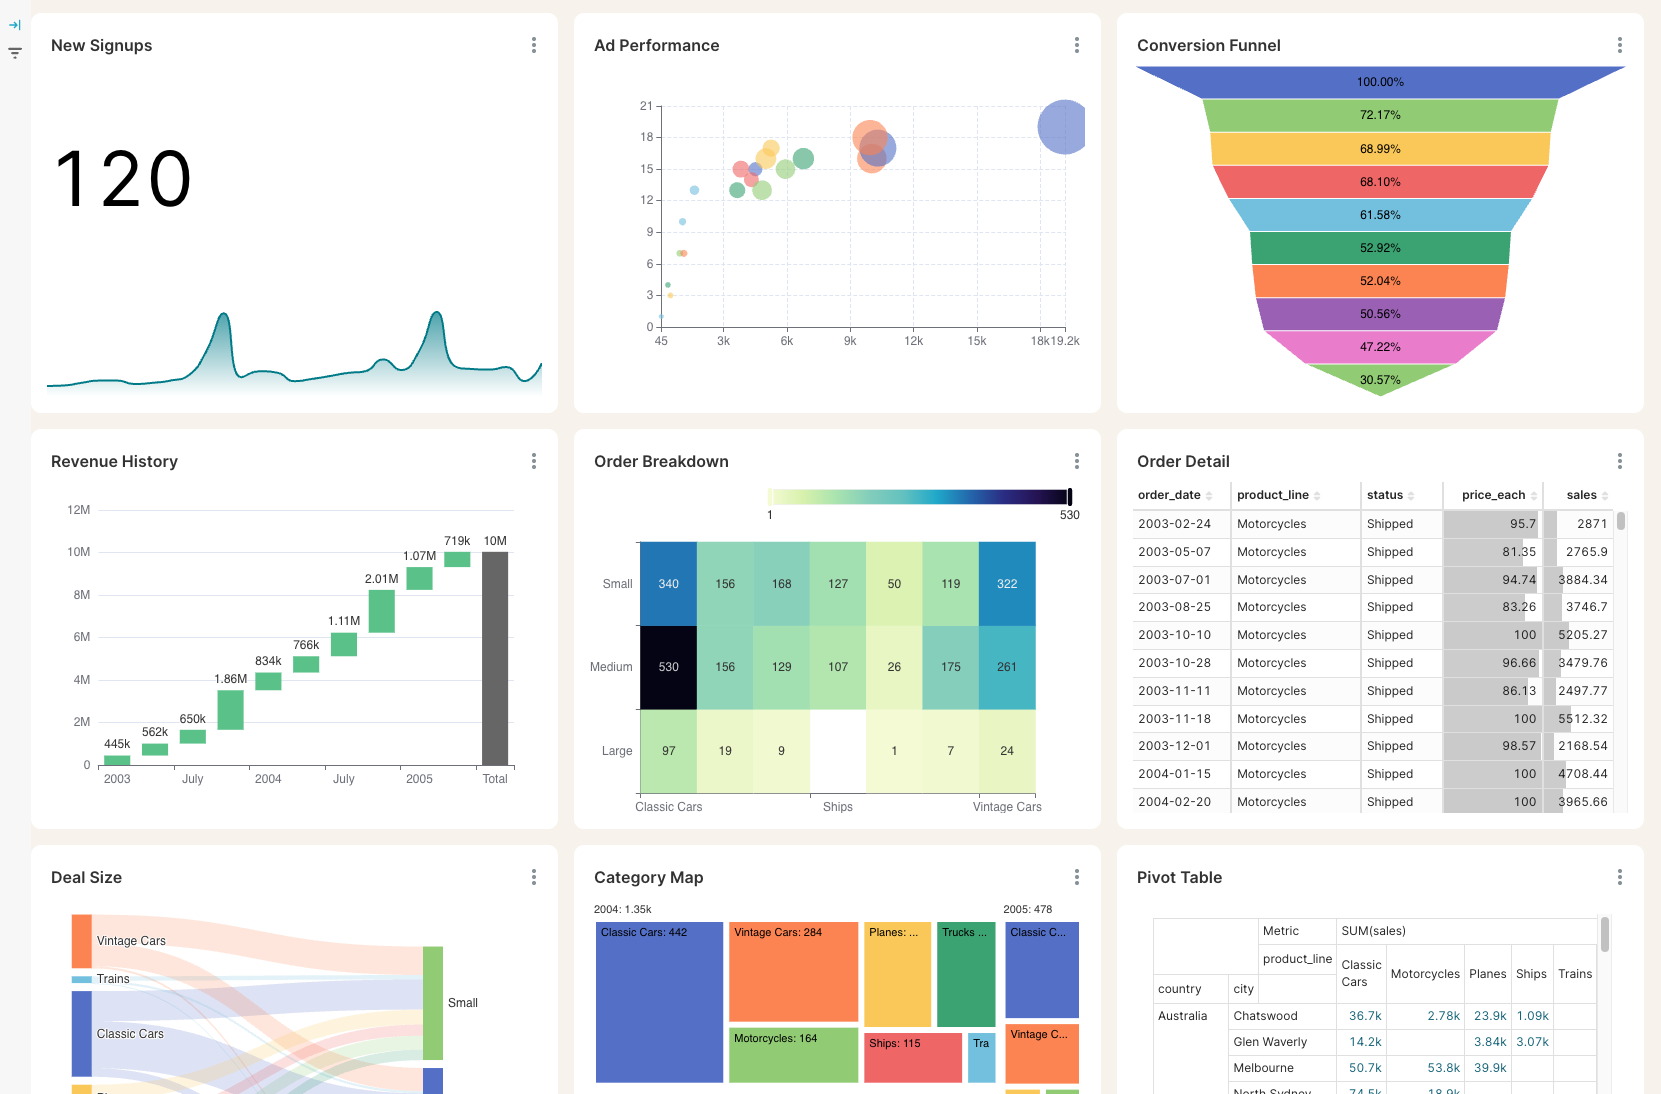
Advanced custom reporting dashboards

Stay on track with real time visibility & alerts

Set clear goals, track progress in real time, and get alerts the moment a KPI slips or beats target. Acting proactively & not reactively means you're no longer the last to know.
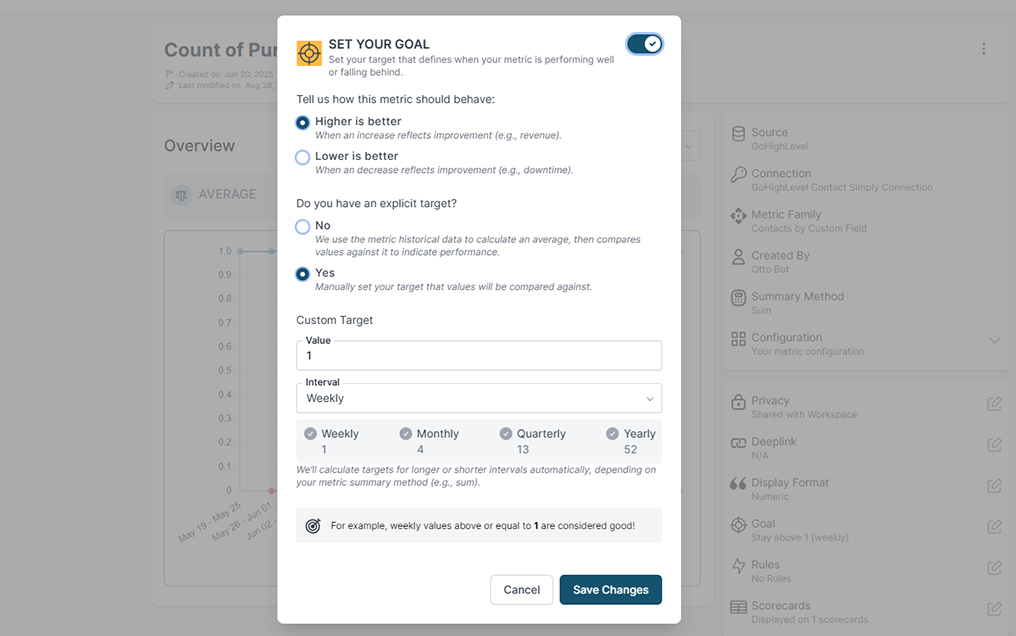
Goal setting and real-time alerts

Keep your team in the loop and accountable

Keep goals front and center with reports designed for each person, team, or location — shared in real time to keep performance transparent and encourage accountability.
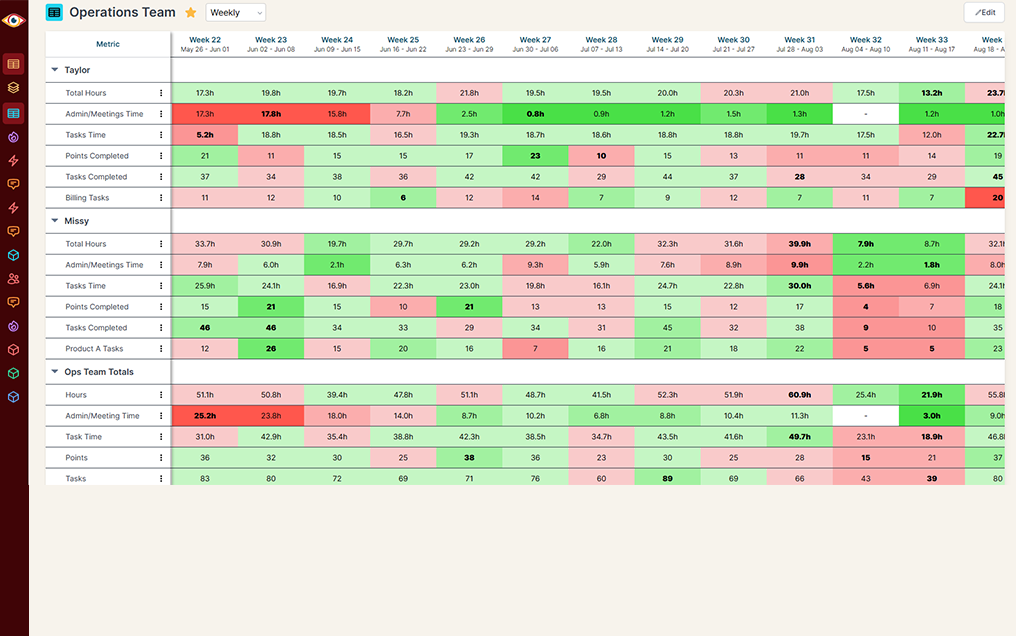
Operations scorecard for team accountability

Do you have questions that are difficult or impossible to answer with Harvest's built-in reporting?

BlinkMetrics turns your Harvest data into project P&Ls, utilization dashboards, budget-vs-actual reports, and cross-system analysis your team can't get from Harvest alone.

Harvest alone Harvest + BlinkMetrics
Team Member, Phase & Task-Level Breakdowns
  • Project-Level Only. Native reports stay at the project or client level. Slicing billable hours, revenue, or productivity by individual team member, project phase, or task is tedious at best.
  • Slice It Any Way You Need. Break every metric down to the person, phase, or task. See exactly who is driving billable work, where time is leaking, and which tasks consistently run over.
Project Profitability — Revenue Minus Expenses
  • Time And Expenses In Separate Reports. Harvest treats hours and expenses as separate worlds, so there's no view that combines them into a true project P&L.
  • One Project P&L. See revenue, time costs, and expenses together for every project. Instantly spot which projects, clients, and engagement types actually make money.
Utilization Rate & Billable Percentage
  • Not Built In. Harvest has no native utilization or billable-percentage metric. Teams export time entries to Excel and rebuild the formula every month.
  • Always-On Utilization Tracking. Track utilization rate, billable percentage, and capacity by person, team, or department directly on your dashboard, updated daily.
Budget vs. Actual (Planned vs. Actual)
  • Manual Comparison. Comparing planned hours, expenses, or revenue against actuals across many projects is a manual spreadsheet exercise.
  • Side-By-Side On One Screen. Planned-vs-actual reporting across hours, expenses, and revenue. Flag projects trending over budget before they blow past it.
Expense Categories & Spend Analysis
  • Basic Expense Reports. No custom categories, no deep analysis, and no easy way to look at expenses alongside time-tracking data.
  • Expenses In Full Context. Group expenses by your own custom categories, blend them with time data, and trend spend by client, project, or category over any window.
Cross-Project & Multi-Client Dashboards
  • One Project At A Time. Native reports look at a single project or client in isolation, so comparing accounts side-by-side means opening a stack of browser tabs.
  • All Your Projects On One Screen. Put every project or client side-by-side in a single view so you can instantly spot the accounts pulling weight and the ones quietly slipping.
Custom & Ad-Hoc Reporting
  • Fixed Templates Only. Harvest ships a handful of pre-built reports with no way to build your own when the question changes.
  • Built Around Your Questions. Your dashboard is custom-built by our team to answer exactly what you care about, and our analyst stays on call to add new views as your business evolves.
Custom Time Frames & Quarterly Views
  • Preset Windows Only. You get a short list of date-range buttons. No fiscal years, no rolling 13-week views, no custom quarters.
  • Any Window You Want. Look at any custom date range, fiscal quarter, rolling window, or year-over-year comparison without exporting to a spreadsheet.
Calculated KPIs & Blended Metrics
  • No Formula Builder. Ratios, blended KPIs, and custom calculations all force a CSV export into Excel.
  • Your KPIs, Built In. The metrics that matter to your business (effective hourly rate, revenue per head, average collection days) live directly on your dashboard, not in a spreadsheet.
Multi-Source Blending
  • Harvest Only. Native reports can't pull in your accounting, CRM, or project-management data, so billing stays disconnected from the rest of the business.
  • Harvest Plus Everything Else. Blend Harvest with QuickBooks, HubSpot, Asana, Stripe, and 100+ other tools to see invoicing, sales, and operations in a single picture.
Ask Questions in Plain English
  • No Question Box. Every new question means configuring a new report by hand.
  • Just Ask. Type questions like "Which projects went over budget last quarter?" or "Who had the highest billable percentage in Q1?" and get an instant answer pulled straight from your data.
Drill-Down & Custom Exports
  • Thin Exports. CSV exports are missing the columns you need, can't be customized, and don't let you dig into the underlying records.
  • Click Any Number, See The Records. Click any chart to drop into the underlying rows. Filter, sort, and export exactly the columns you need for follow-up analysis.

Harvest alone

Team Member, Phase & Task-Level Breakdowns

  • Project-Level Only. Native reports stay at the project or client level. Slicing billable hours, revenue, or productivity by individual team member, project phase, or task is tedious at best.

Project Profitability — Revenue Minus Expenses

  • Time And Expenses In Separate Reports. Harvest treats hours and expenses as separate worlds, so there's no view that combines them into a true project P&L.

Utilization Rate & Billable Percentage

  • Not Built In. Harvest has no native utilization or billable-percentage metric. Teams export time entries to Excel and rebuild the formula every month.

Budget vs. Actual (Planned vs. Actual)

  • Manual Comparison. Comparing planned hours, expenses, or revenue against actuals across many projects is a manual spreadsheet exercise.

Expense Categories & Spend Analysis

  • Basic Expense Reports. No custom categories, no deep analysis, and no easy way to look at expenses alongside time-tracking data.

Cross-Project & Multi-Client Dashboards

  • One Project At A Time. Native reports look at a single project or client in isolation, so comparing accounts side-by-side means opening a stack of browser tabs.

Custom & Ad-Hoc Reporting

  • Fixed Templates Only. Harvest ships a handful of pre-built reports with no way to build your own when the question changes.

Custom Time Frames & Quarterly Views

  • Preset Windows Only. You get a short list of date-range buttons. No fiscal years, no rolling 13-week views, no custom quarters.

Calculated KPIs & Blended Metrics

  • No Formula Builder. Ratios, blended KPIs, and custom calculations all force a CSV export into Excel.

Multi-Source Blending

  • Harvest Only. Native reports can't pull in your accounting, CRM, or project-management data, so billing stays disconnected from the rest of the business.

Ask Questions in Plain English

  • No Question Box. Every new question means configuring a new report by hand.

Drill-Down & Custom Exports

  • Thin Exports. CSV exports are missing the columns you need, can't be customized, and don't let you dig into the underlying records.

Harvest + BlinkMetrics

Team Member, Phase & Task-Level Breakdowns

  • Slice It Any Way You Need. Break every metric down to the person, phase, or task. See exactly who is driving billable work, where time is leaking, and which tasks consistently run over.

Project Profitability — Revenue Minus Expenses

  • One Project P&L. See revenue, time costs, and expenses together for every project. Instantly spot which projects, clients, and engagement types actually make money.

Utilization Rate & Billable Percentage

  • Always-On Utilization Tracking. Track utilization rate, billable percentage, and capacity by person, team, or department directly on your dashboard, updated daily.

Budget vs. Actual (Planned vs. Actual)

  • Side-By-Side On One Screen. Planned-vs-actual reporting across hours, expenses, and revenue. Flag projects trending over budget before they blow past it.

Expense Categories & Spend Analysis

  • Expenses In Full Context. Group expenses by your own custom categories, blend them with time data, and trend spend by client, project, or category over any window.

Cross-Project & Multi-Client Dashboards

  • All Your Projects On One Screen. Put every project or client side-by-side in a single view so you can instantly spot the accounts pulling weight and the ones quietly slipping.

Custom & Ad-Hoc Reporting

  • Built Around Your Questions. Your dashboard is custom-built by our team to answer exactly what you care about, and our analyst stays on call to add new views as your business evolves.

Custom Time Frames & Quarterly Views

  • Any Window You Want. Look at any custom date range, fiscal quarter, rolling window, or year-over-year comparison without exporting to a spreadsheet.

Calculated KPIs & Blended Metrics

  • Your KPIs, Built In. The metrics that matter to your business (effective hourly rate, revenue per head, average collection days) live directly on your dashboard, not in a spreadsheet.

Multi-Source Blending

  • Harvest Plus Everything Else. Blend Harvest with QuickBooks, HubSpot, Asana, Stripe, and 100+ other tools to see invoicing, sales, and operations in a single picture.

Ask Questions in Plain English

  • Just Ask. Type questions like "Which projects went over budget last quarter?" or "Who had the highest billable percentage in Q1?" and get an instant answer pulled straight from your data.

Drill-Down & Custom Exports

  • Click Any Number, See The Records. Click any chart to drop into the underlying rows. Filter, sort, and export exactly the columns you need for follow-up analysis.

Complete visibility in 30 days. We'll build you the ultimate Harvest reporting dashboard

Easily see what's difficult or impossible to see in Harvest

book a discovery call

Have questions about what's possible or how this works?

These are the questions we get most frequently, but we'd love to talk with you on a quick call.

  • Do you handle the setup, or will my team need to do it?

    Your BlinkMetrics dashboard is fully done-for-you. No coding or developers are required. You just tell us what you want and our team builds it.

  • How long does it take to get my BlinkMetrics + Harvest dashboard live?

    Setup is quick and simple. Connecting your Harvest account and other data sources takes just a few minutes. Our team will deliver your custom dashboard in 30-days or less.

  • What happens during a BlinkMetrics + Harvest demo?

    Meet with our founder, Nathan, to walk through a live BlinkMetrics Harvest dashboard and visualize what deeper Harvest reporting could look like for you.

  • What will I see in BlinkMetrics that I can't get from native Harvest reporting?

    True project profitability (revenue, time costs, and expenses in one view), utilization and billable percentage by person and team, budget-vs-actual across every project, expense analysis by custom category, and the ability to slice every metric by team member, phase, or task. You can also blend Harvest with QuickBooks or your CRM and ask questions in plain English. Harvest's native reporting supports none of that.

  • Can BlinkMetrics combine Harvest with my other business tools?

    Yes. We pull your Harvest data into a dedicated analytics layer alongside data from your CRM, accounting, and project-management tools. From there your dashboard can answer cross-system questions like which clients drive the most invoiced revenue, how billing trends look across fiscal quarters, and which accounts are growing or shrinking, without manually exporting and joining spreadsheets.

  • Can BlinkMetrics build different dashboards for different teams?

    Yes. We can build focused dashboards for different audiences (operations, leadership, finance, client services) using the same underlying Harvest data. Each group gets its own views, filters, and KPIs without duplicating work, so people only see what's relevant to them while you maintain a single source of truth.

Ready for the ultimate Harvest reporting dashboard?

Our Harvest customers have run into the limits of native reporting: no project profitability, no utilization tracking, no team-member breakdowns, and no way to blend hours, expenses, and revenue in one view. We fix all of that. Your custom done-for-you dashboard goes live in 30 days, guaranteed.

book a call to see what's possible