
Advanced QuickBooks reporting for businesses that push QuickBooks to its limits
Go beyond revenue totals to see true profitability across clients, projects, and departments. You know some of QuickBooks's frustrating limitations. We fix them.
book a discovery call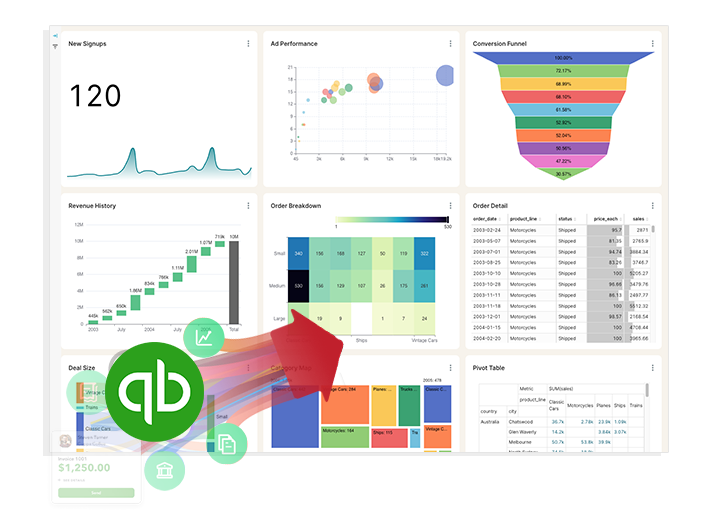
See BlinkMetrics in action
Move beyond QuickBooks' surface-level reports. See how our integration uncovers the hidden profitability, cash flow, and operational insights your business has been missing.
book demo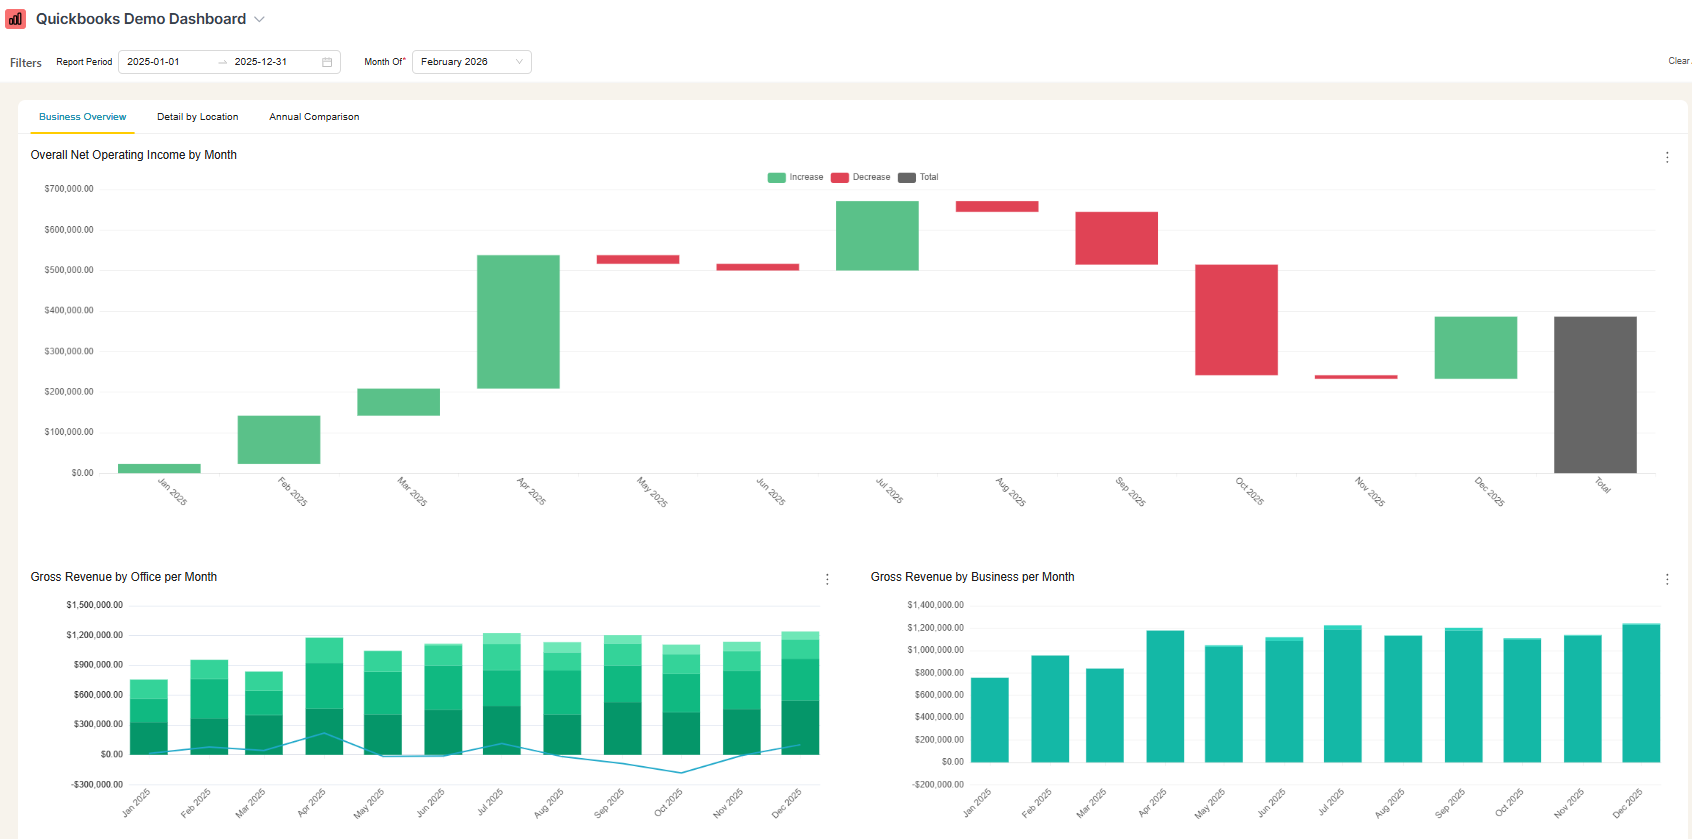
Spreadsheets get you close, but they won't get you all the way
-

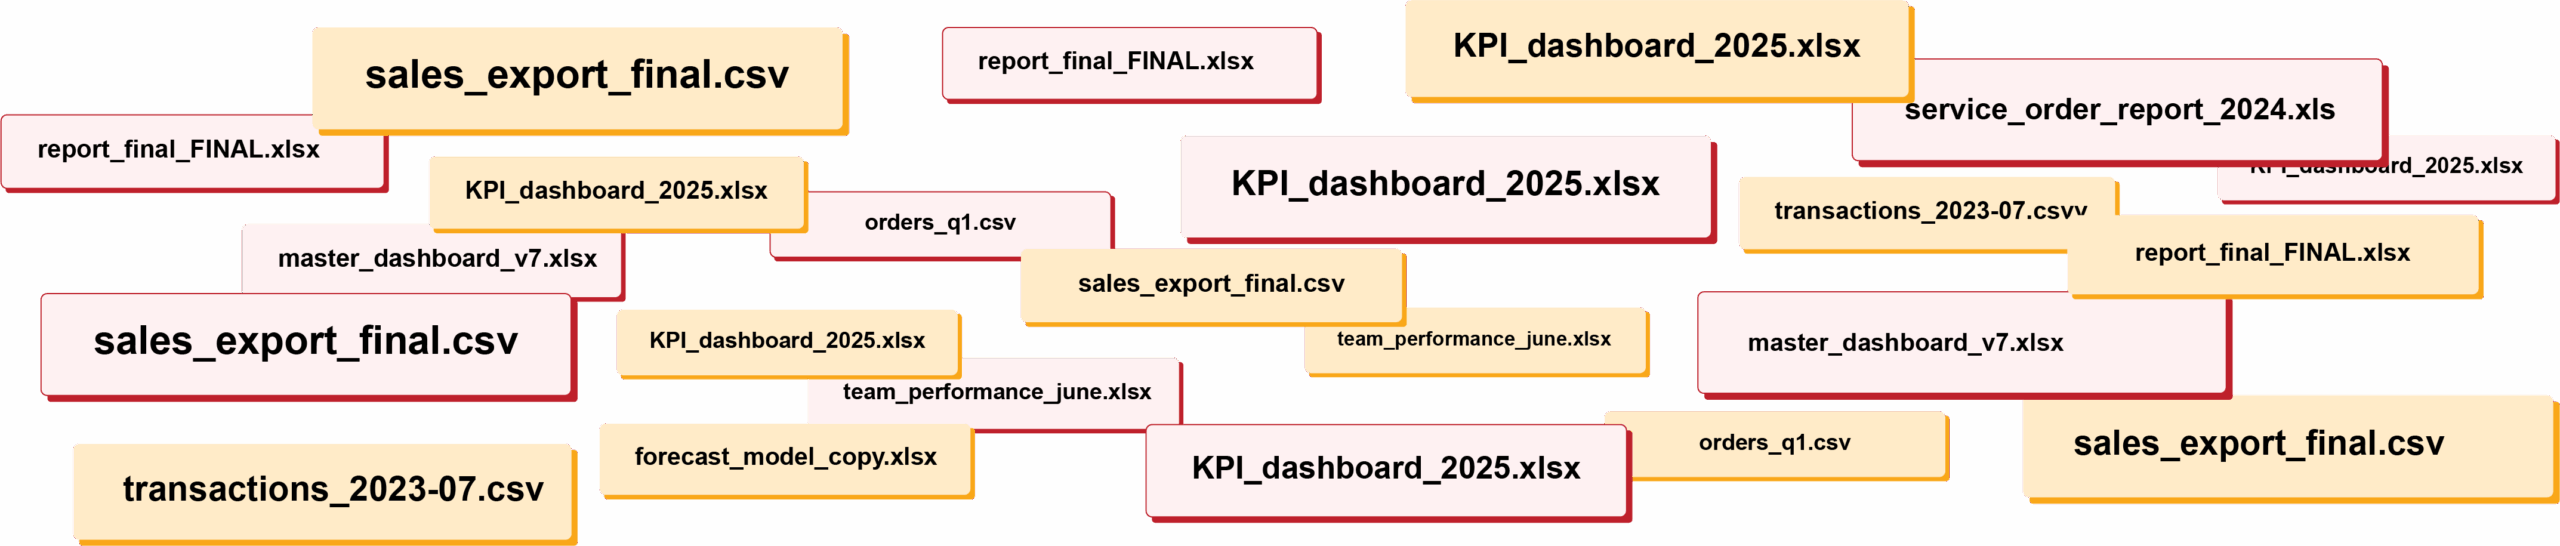
Endless CSV Exports
-
Hours to find an answer
-

Broken links, Zaps & formulas
-

Numbers are difficult to verify
-
Everything breaking as you scale
RIP spreadsheets. BlinkMetrics brings your reporting into live dashboards that show what's really happening in your business.
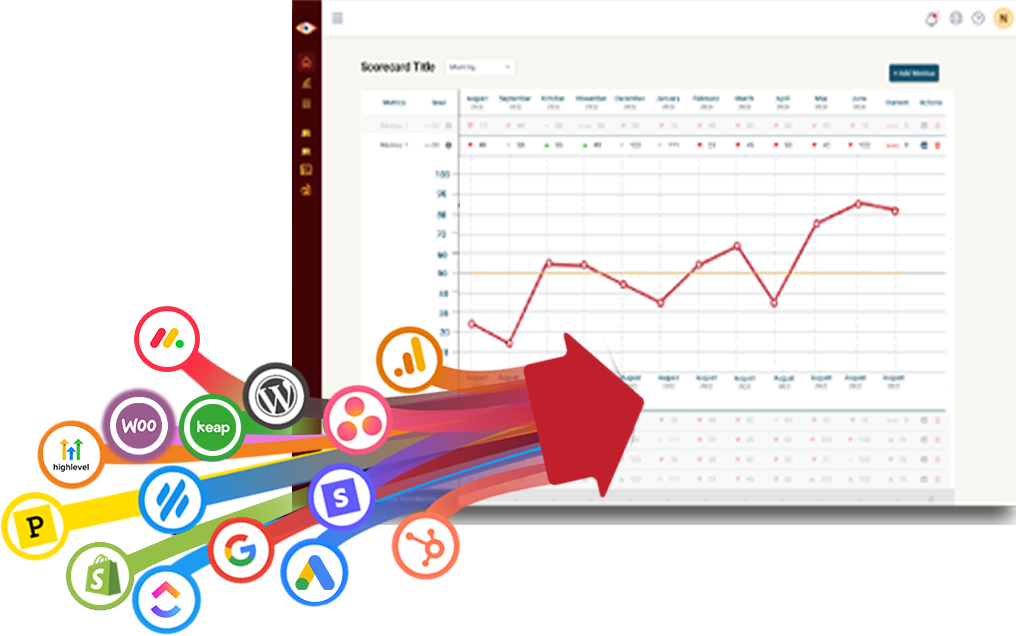
Easily connect to any business tool
We capture raw data from any platform and keep it updated continuously. You'll always have the live numbers, full history, and ability to drill into any KPI for the details that explain it.
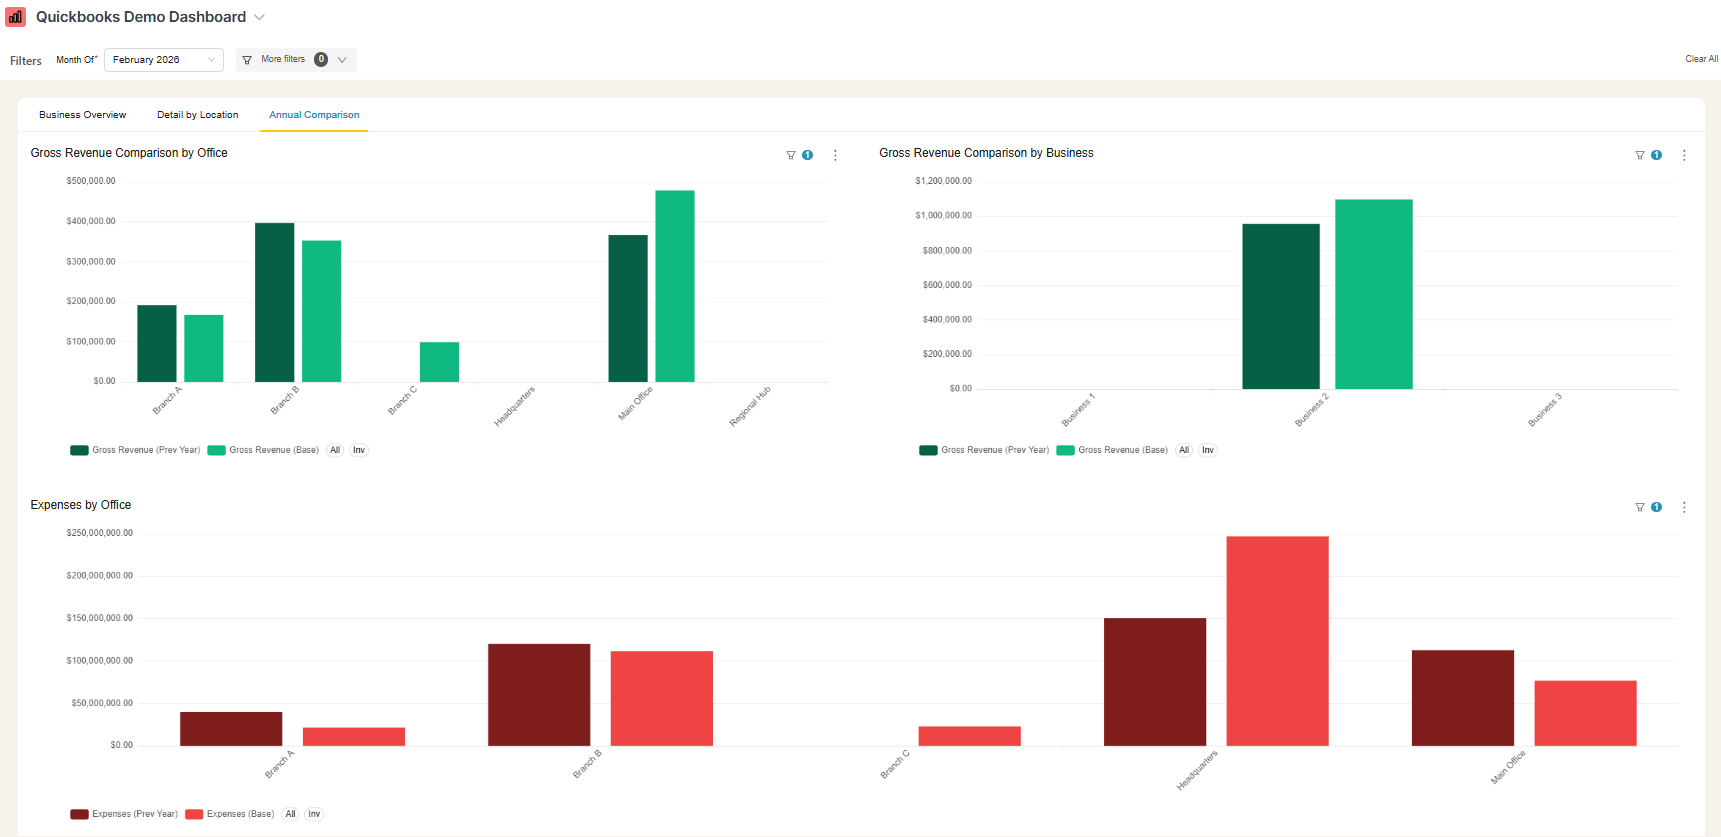
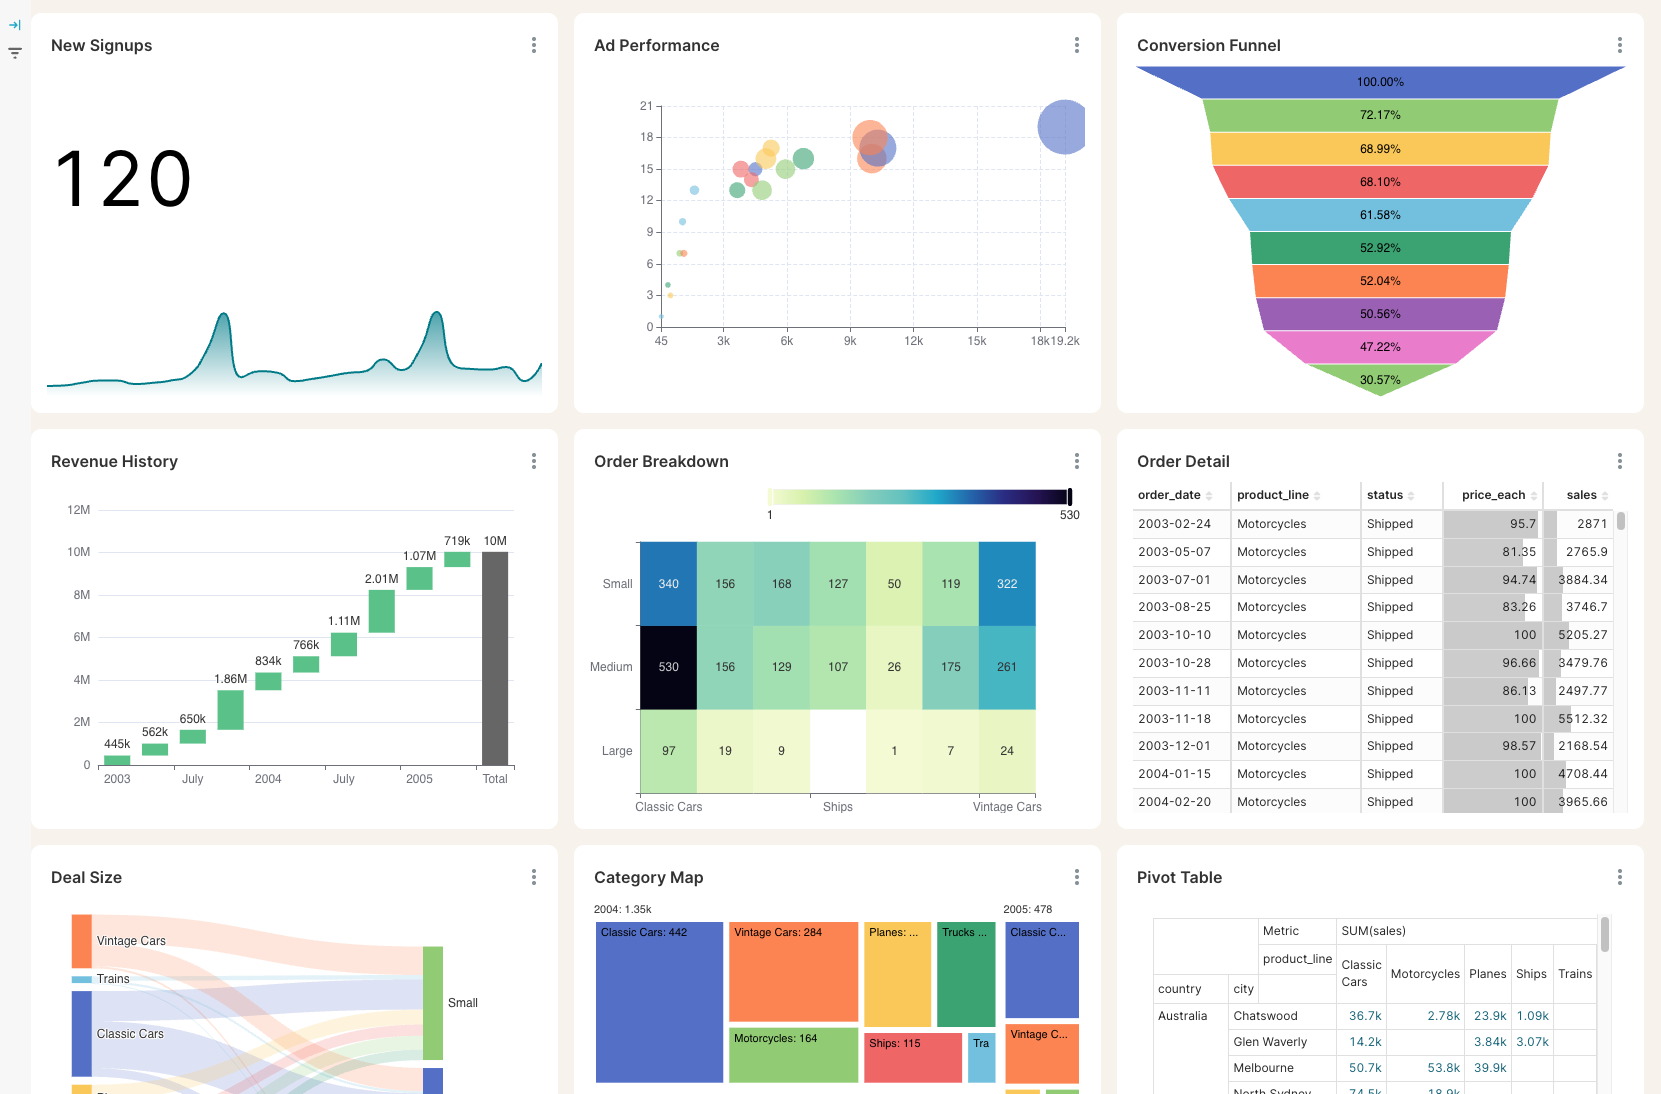
Get the reporting you never could before
Access custom reports with interactive dashboards & scorecards, giving you answers to questions you've never been able to answer easily. Look deeper into any number, explore trends, and slice & dice results by any segment.
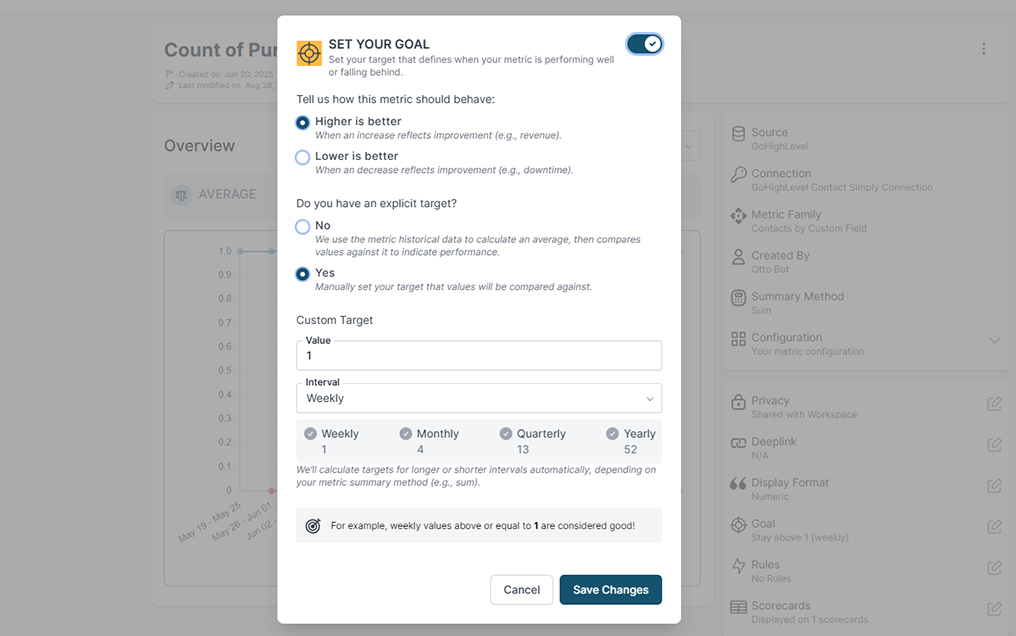
Stay on track with real time visibility & alerts
Set clear goals, track progress in real time, and get alerts the moment a KPI slips or beats target. Acting proactively & not reactively means you're no longer the last to know.
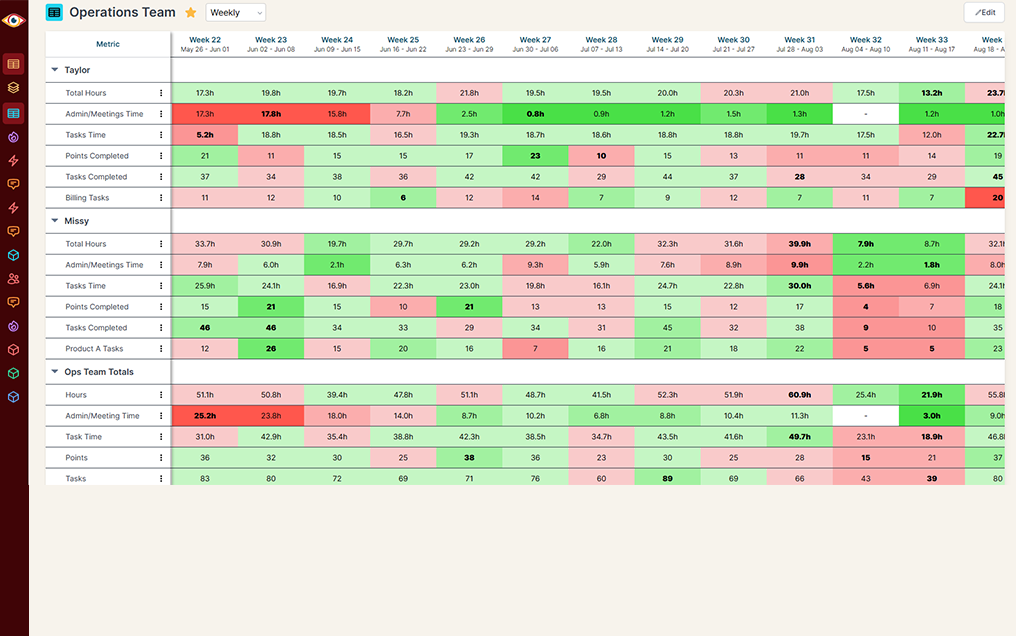
Keep your team in the loop and accountable
Keep goals front and center with reports designed for each person, team, or location — shared in real time to keep performance transparent and encourage accountability.
Do you have questions that are difficult or impossible to answer with QuickBooks' built-in reporting?
BlinkMetrics gives you instant visibility into every corner of your QuickBooks account.
QuickBooks alone
Report Customization
Filtering & Segmentation
Handling Large Data Sets
User & Access Controls
Visualization & Dashboards
Custom Fields & Tracking
Data Export & Integration
Collaboration Features
Ongoing Innovation
QuickBooks + BlinkMetrics
Report Customization
Filtering & Segmentation
Handling Large Data Sets
User & Access Controls
Visualization & Dashboards
Custom Fields & Tracking
Data Export & Integration
Collaboration Features
Ongoing Innovation
Complete visibility in 30 days — we'll build you the ultimate QuickBooks reporting dashboard
Easily see what's difficult or impossible to see in QuickBooks
Have questions about what's possible or how this works?
These are the questions we get most frequently, but we'd love to talk with you on a quick call.
-
Do you handle the setup, or will my team need to do it?
Your BlinkMetrics dashboard is fully done-for-you. No coding or developers are required. You just tell us what you want and our team builds it.
-
How long does it take to get my BlinkMetrics + QuickBooks dashboard live?
Setup is quick and simple. Connecting your QuickBooks account and other data sources takes just a few minutes. Our team will deliver your custom dashboard in 30-days or less.
-
What happens during a BlinkMetrics + QuickBooks demo?
Meet with our founder, Nathan, to walk through a live BlinkMetrics QuickBooks dashboard and visualize what deeper QuickBooks reporting could look like for you.
-
Can I combine data from other tools besides QuickBooks?
Yes. BlinkMetrics supports multiple data sources, so you can view QuickBooks metrics alongside data from HubSpot, Stripe, Shopify, and 100+ other platforms in one unified dashboard.
-
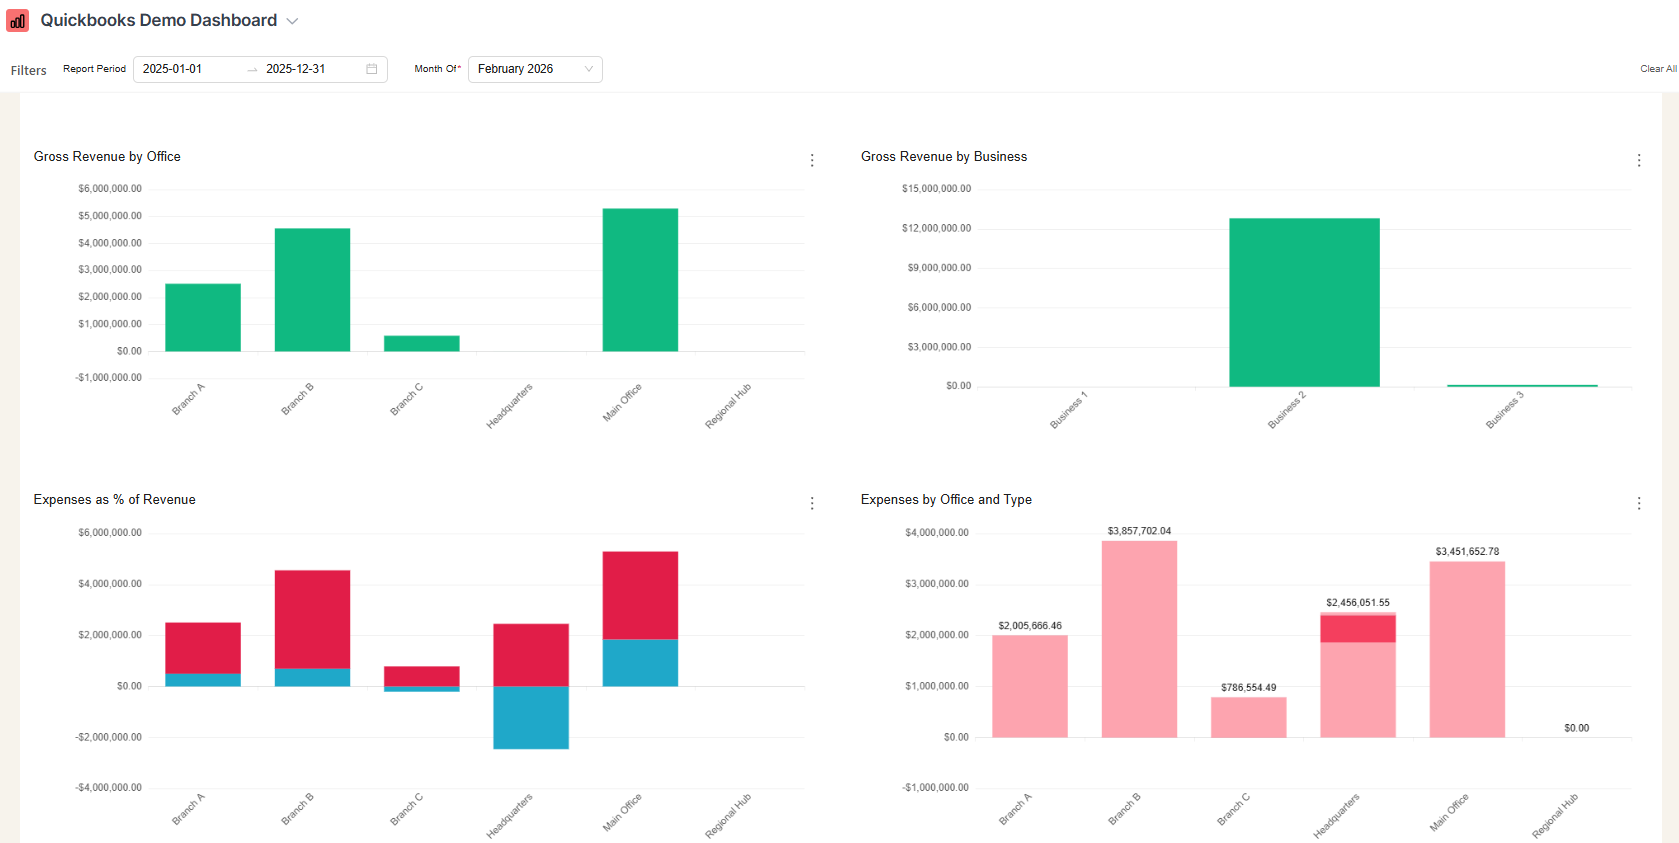
What will I see in BlinkMetrics that I can't get from native QuickBooks reporting?
True profitability by client, project, department, or campaign — not just revenue totals. Cash-flow forecasts blended with sales and marketing data. Cross-entity rollups, custom KPIs, and historical trends that QuickBooks reports either bury or skip entirely.
-
How does BlinkMetrics handle historical QuickBooks reporting?
We pull and store your QuickBooks data in a dedicated analytics layer so you can compare any period — month over month, year over year, this quarter vs. last — and chart trends in revenue, expenses, margins, and cash flow without manually exporting or rebuilding reports.

Ready for the ultimate QuickBooks reporting dashboard?
From sales trends to customer behavior, discover the answers that help you grow faster, smarter, and more profitably. We know exactly where QuickBooks' native reports run out of road, and we build the dashboards that close every gap.
book a call to see what's possible