

Pipedrive shows your pipeline as it exists right now: open deals, their stages, values, and owners. What it can’t show you is your Pipedrive pipeline history on a specific date. There’s no way to ask “what deals were in the Qualified stage on January 1st?” or “how much potential revenue did we have in the pipeline entering last quarter?”
Once a deal moves stages or closes, the pipeline view updates and the previous state is gone. Pipedrive’s Insights dashboard tracks Closed Won trends and deal conversion rates, but it doesn’t offer a point-in-time reconstruction of your full pipeline.
For QBRs, forecast reviews, and pipeline health tracking, this is a gap. Here’s what Pipedrive does and doesn’t provide, and how to fill in the missing piece.
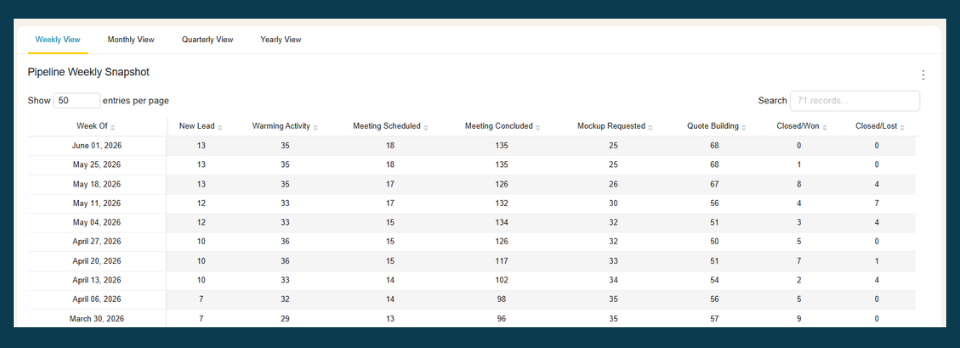
See your Pipedrive pipeline as it looked on any past date — automatically. BlinkMetrics captures a daily snapshot of your pipeline, so the history Pipedrive never stored is there when you need it:
- Automatic daily snapshots of every deal’s stage, value, owner, and expected close date
- Set any past date and read the pipeline exactly as it stood then — no CSV exports to maintain
- Compare two dates (quarter start vs. close) for QBRs, forecast reconciliation, and slippage analysis
→ See your Pipedrive pipeline at the start of last quarter — book a 1:1 with our founder, Nathan
If you’re running Pipedrive and need this historical view today, BlinkMetrics’ Pipedrive reporting captures daily pipeline snapshots automatically and lets you query any past date. The rest of this post walks through the manual path and where it breaks down, then shows what the automated approach looks like.
Why Pipedrive pipeline history matters for sales reviews
Most pipeline questions aren’t about current state. They’re about explaining what changed between two points in time because leaders need that important information to drive the business.
Quarterly business reviews are the most common example. Your Sales lead wants to compare pipeline entering Q1 versus pipeline at Q1 close. How much was added? How much slipped? What converted? Answering these questions requires knowing exactly what was in the pipeline on both dates.
Forecast reconciliation is similar. You anticipated $350k closing this quarter. $200k actually closed. To understand the gap, you need to trace back to the deals that were in the pipeline at forecast time, then see which ones slipped, shrank, or fell out entirely to spot pro opportunities. Pipedrive can tell you what closed. It can’t show you what was predicted to close.
Pipeline velocity tracking requires snapshots too. Understanding how long deals spend in each stage means tracking stage assignments over time. Current-state data tells you where deals are today. Historical data tells you how they moved and how fast.
Rep performance reviews often compare a rep’s pipeline at the start of a period against their actual results. Without a historical view, managers piece this together from memory or old spreadsheet exports.
What Pipedrive’s Insights dashboard actually shows
Pipedrive’s native reporting is solid for current-state analysis. Here’s what you can get from Insights:
- Pipeline view: Open deals organized by stage, filterable by pipeline, owner, and custom fields
- Deal reports: Total deal value, deal count, and revenue by stage or time period
- Revenue forecast: Expected revenue based on deal probability and close dates
- Conversion reports: Win rates and stage-to-stage conversion percentages
- Activities reports: Completed calls, emails, and meetings by rep and time period
Where Insights falls short is any question that requires a point-in-time view. A “deals won in Q4” report shows results. It doesn’t show what the pipeline looked like entering Q4 or which deals were there but didn’t close.
Pipedrive’s developer community has threads requesting pipeline stage history at the API level. This confirms it’s a recognized gap, not an uncommon need.
What about Pipedrive’s Rotting deals feature?
Pipedrive has a useful feature called Rotting deals that flags deals sitting in a stage longer than a defined threshold. If a deal hasn’t had activity in 30 days (or whatever period you set), it gets a visual indicator.
This helps with pipeline hygiene. It catches stale deals that reps may have forgotten about.
But Rotting deals doesn’t solve the snapshot problem. It tells you which deals are idle right now. It doesn’t tell you:
- What your pipeline looked like on a past date
- Which deals were open at the start of last quarter
- How total pipeline value changed week over week
- What stage a deal was in 60 days ago
Rotting deals is about surfacing current inaction. Pipeline history is about reconstructing past state. They solve different problems.
Pipedrive’s Activities timeline: useful but not a substitute
Pipedrive tracks Activities (calls, emails, meetings, tasks) at the deal level. You can open any deal and see a log of everything that happened and when. This is helpful for understanding a single deal’s progression.
The limitation is that Activities are per-deal, not aggregated. There’s no way to use the Activities timeline to answer “what did my full pipeline look like on March 1st?” You’d have to open every deal individually, check its activity log and stage changes, and manually reconstruct the pipeline. That’s not practical with more than a handful of deals.
How to get Pipedrive pipeline history through snapshots
There are two approaches: one manual, one automated.
Manual pipeline snapshots
Some teams export their pipeline on a fixed schedule. The process looks like this:
- Go to the Deals list view in Pipedrive
- Filter to show all open deals
- Export to CSV or Excel (including stage, value, owner, expected close date)
- Save the file with a date stamp (e.g., “pipeline-snapshot-2026-01-01.csv”)
- Repeat at the start of each month or quarter
Over time, this builds a collection of snapshots you can compare.
The problems with this approach:
- Someone has to remember to do it every time
- If a snapshot is missed, that period’s data is unrecoverable
- Comparing two snapshots means loading both spreadsheets and manually matching deals
- The data is flat. You can’t filter or pivot a static CSV the way you would a live report
- As deal volume grows, the manual comparison gets unwieldly and unscalable
Automated pipeline snapshots with a reporting tool
A reporting tool that connects to Pipedrive and stores periodic snapshots of deal state can reconstruct your pipeline as it looked on any past date.
BlinkMetrics stores point-in-time snapshots of your Pipedrive pipeline automatically. Set a date filter on any dashboard and it shows which deals were open on that day, their stage, value, owner, and expected close date at the time.
A practical example: you’re preparing a QBR deck for your sales team. Set the date to October 1st and you see the pipeline as it stood entering Q4. Set it to December 31st and you see where things landed. Compare the two views to show exactly what moved, what closed, what slipped, and what fell out. No spreadsheet archaeology required.
Want to see what your Pipedrive pipeline looked like at the start of last quarter? Let’s chat.
What you can do with historical pipeline data
Once you have point-in-time snapshots, several types of analysis become straightforward.
Pipeline comparison across periods
| Metric | Q4 start | Q4 end | Change |
|---|---|---|---|
| Open deals | 56 | 41 | -15 |
| Total pipeline value | $620k | $485k | -$135k |
| Deals in Proposal stage | 18 | 11 | -7 |
| Average deal size | $11.1k | $11.8k | +$700 |
This table takes two minutes to build when you have snapshots of both dates. Without them, it takes hours of manual reconstruction and educated guessing.
Slippage analysis
Compare deals in the pipeline at forecast time against actual outcomes. Deals that were open but didn’t close either:
- Slipped: Moved to a future expected close date
- Shrunk: Closed at a lower value than forecasted
- Lost: Moved to Lost status
- Stalled: Are still open, just sitting in the same stage
Seeing these patterns by rep, deal size, or source helps you adjust how aggressively you weight future forecasts.
Pipeline value over time
A weekly chart of total open pipeline value surfaces trends before they hit revenue. If pipeline starts declining in week 4 of a quarter, the revenue impact shows up 6-10 weeks later. With historical data, you can spot these patterns early enough to do something about them.
Stage duration analysis
How long do deals spend in each stage on average? Snapshot data lets you track when deals entered and exited each stage, then aggregate across your pipeline:
| Stage | Average days | Target |
|---|---|---|
| Qualified | 8 | 7 |
| Contact made | 12 | 10 |
| Proposal | 15 | 14 |
| Negotiation | 9 | 7 |
Stages that consistently exceed their target duration are bottlenecks worth investigating. This analysis requires historical stage data that Pipedrive’s current-state view doesn’t provide.
See Pipedrive pipeline history in action
Daily pipeline snapshots, calculated KPIs, and the historical reporting Pipedrive doesn’t ship natively, all in a single dashboard. See how BlinkMetrics works with Pipedrive, or book a 30-minute walkthrough and we’ll show you what your Pipedrive pipeline looks like with full historical visibility.
Frequently asked questions
Can Pipedrive show historical pipeline data?
No. Pipedrive’s pipeline view and Insights dashboard reflect the current state of your deals. There’s no native way to ask what deals were in a specific stage on a past date. You can view individual deal activity logs, but there’s no aggregate historical pipeline view. This is a recognized gap in Pipedrive’s reporting capabilities.
Does Pipedrive’s Rotting deals feature help with pipeline history?
Not directly. Rotting deals flags deals that have been inactive in a stage beyond a set threshold. It’s useful for pipeline hygiene, but it only shows current status. It doesn’t record or reconstruct what your pipeline looked like at a previous point in time.
How do I compare my Pipedrive pipeline between two dates?
You have two options. The manual approach is exporting your deal list on a regular schedule and saving dated copies. The automated approach is using a reporting tool like BlinkMetrics that stores periodic snapshots of your Pipedrive data. With snapshots, you set two dates and compare the pipeline side by side without any manual exports.
What is a pipeline snapshot?
A pipeline snapshot is a record of your pipeline state at a specific point in time: which deals were open, what stage they were in, their values, owners, and expected close dates. Pipedrive doesn’t store these automatically. You either create them manually through regular exports or use a reporting tool that captures and stores them on a schedule.
Can I use the Pipedrive API to build historical pipeline views?
The Pipedrive API gives you access to current deal data and some change history at the deal level. But building a full historical pipeline view from the API requires capturing and storing snapshots yourself, which means building and maintaining a data pipeline. For most teams, a reporting tool that handles this automatically is more practical than a custom API integration.