
The BlinkMetrics® Blog
Reporting Dashboards
12 articles in this category. Browse all articles →
book demoLatest in Reporting Dashboards
Shadow deals: why your HubSpot pipeline data is lying to you (and how to fix it)
April 7, 2026
Shadow deals get logged in HubSpot after they're won, corrupting your sales cycle data and conversion rates. Here's what causes them and how to fix the data.
Read article →Browse categories
More in Reporting Dashboards
-
 Reporting Dashboards
How to see what your HubSpot pipeline looked like at any point in the past
April 7, 2026
HubSpot only shows your current pipeline. There's no way to see what deals were in each stage last month. Here's how to get historical pipeline snapshots.
-
 Reporting Dashboards
How to automate sales bonus calculations directly from HubSpot
April 7, 2026
HubSpot has no built-in commission calculator. Here's how to apply bonus rules to closed deals and auto-calculate payouts without a separate ICM tool.
-
 Reporting Dashboards
The accidental analyst's guide to building a business dashboard
March 3, 2026
You're the most data-capable person at your company, so the messy projects land on you. Here's how to build a business dashboard without a data team.
-
 Reporting Dashboards
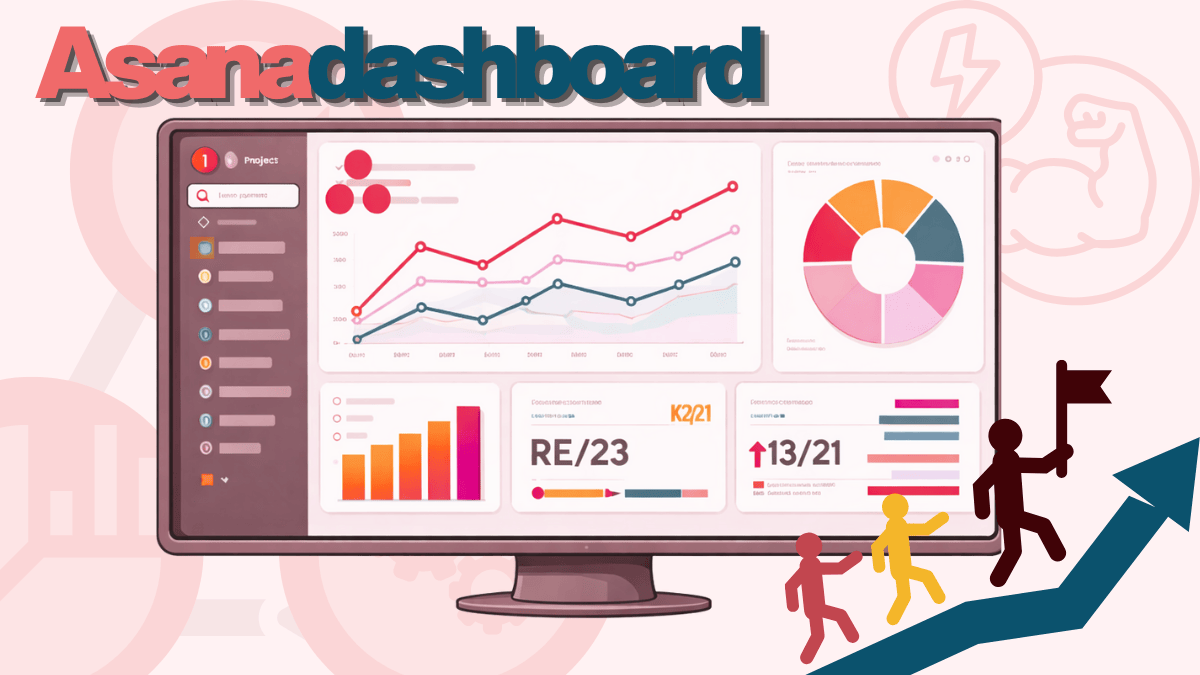
Asana KPI dashboard: how to track key metrics
February 28, 2026
Asana dashboards show task counts, completion rates, and workload distribution. What they don't show: on-time delivery percentage, velocity trends, or any metric that requires a formula.
-
 Reporting Dashboards
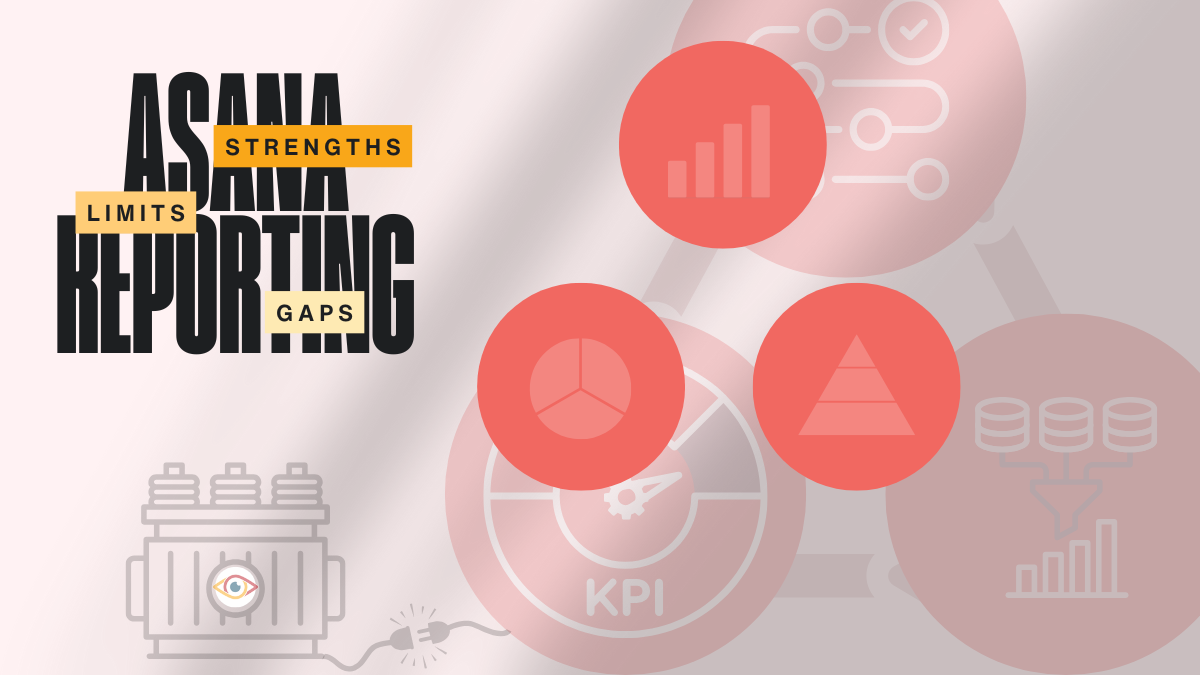
The complete guide to Asana dashboards (2026)
February 28, 2026
This guide walks through Asana project dashboards, portfolio views, and cross-project reporting, explains where native Asana reporting shines and where it falls short, and shows when tools like BlinkMetrics can fill the gaps with historical tracking, calculated KPIs, and multi-source dashboards.
-
 Reporting Dashboards
Asana dashboard examples: 13+ templates and ideas for your team
February 25, 2026
In this guide, you’ll see 13+ practical Asana dashboard examples for campaigns, sprints, client projects, events, and leadership portfolios, along with recommended widgets and custom fields for each.
-
 Reporting Dashboards
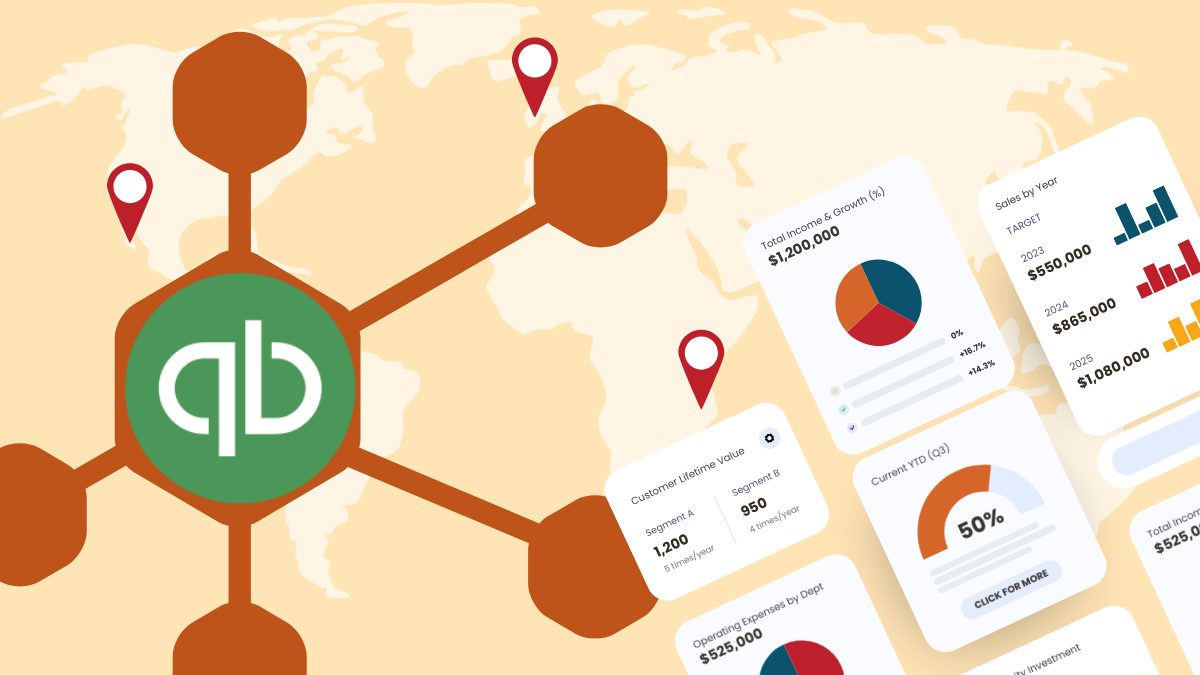
QuickBooks dashboard for multi-location reporting: how to visualize financial KPIs across offices
February 4, 2026
QuickBooks Online can track multi-location performance with classes or locations, but its built-in visuals fall short for founders and partners who need to see trends at a glance. In this guide, we show how to turn your QuickBooks data into clear, automated dashboards that highlight revenue, profitability, and efficiency across every office without spending hours rebuilding spreadsheets.
-
 Reporting Dashboards
Asana portfolio reporting: what's available & what's missing
February 3, 2026
Asana portfolios show project status, milestones, and team capacity, but their analytics stop at basic summaries. This post explains what native portfolio reporting offers, why it limits deeper analysis, and how external tools can bridge the gap for richer portfolio insights.
-
 Reporting Dashboards
What can an Asana dashboard empower your team to do?
January 31, 2026
Asana dashboards give your team real-time visibility into project status, workload distribution, and goal progress. They're effective for tracking task completion and communicating status to stakeholders, but they have practical limits once you're managing multiple projects or need historical analysis.
-
 Reporting Dashboards
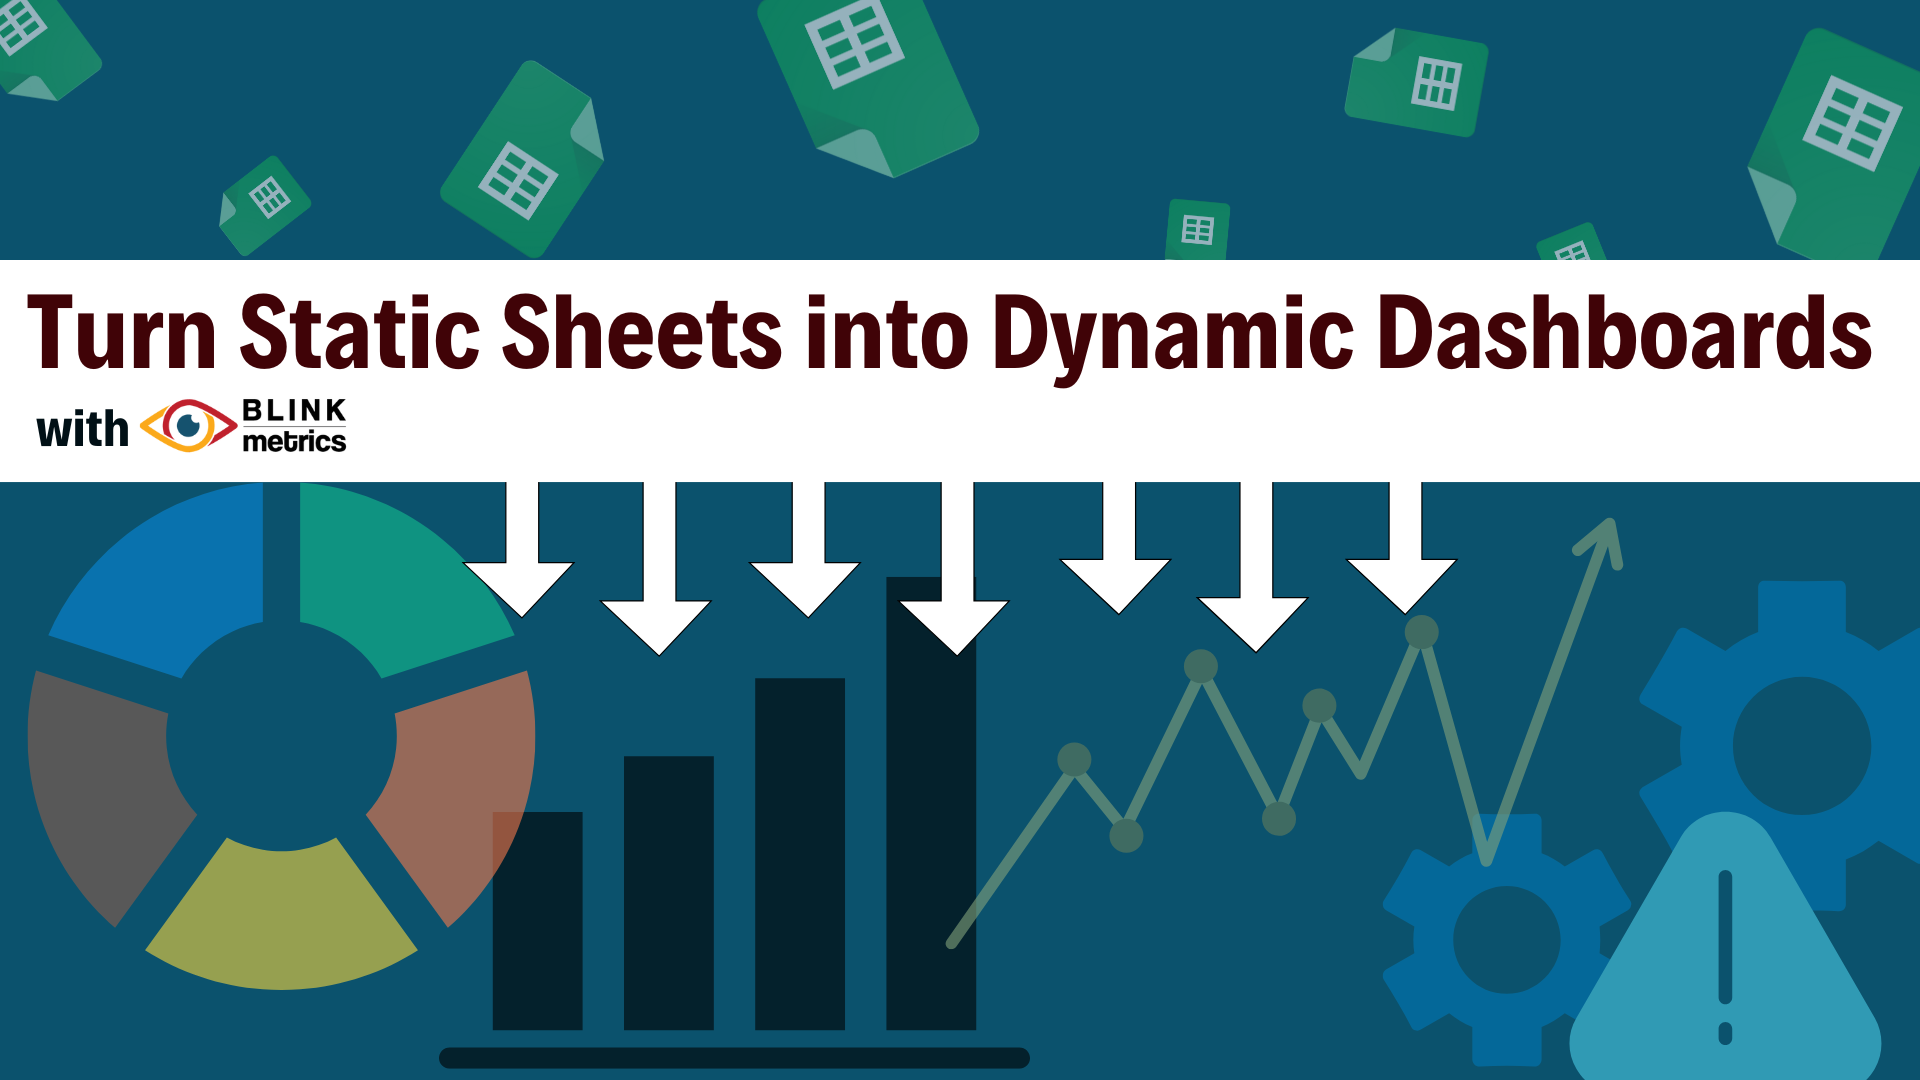
How to upgrade your Google Sheet visualization tool and turn static sheets into dynamic dashboards with BlinkMetrics
January 8, 2026
Upgrade your reporting with a Google Sheet visualization tool that keeps Sheets as your data hub while BlinkMetrics builds automated, interactive dashboards that blend metrics from across your business.
-
 Reporting Dashboards
Unlocking Growth: A Guide to Effectively Using PostHog for Metrics Tracking and Reporting
July 30, 2024
PostHog is one of the most powerful tools for improving your business, but the depth of its features can make it feel overwhelming and nearly impossible to “get it right.”