

GoHighLevel shows your pipeline as it exists right now: which opportunities are open, what stage they’re in, their values, their owners. What it can’t show you is what your GoHighLevel pipeline looked like on the first of last month, at the start of the quarter, or the day before a key opportunity disappeared.
There’s no native way to ask GHL “what opportunities were in the Proposal stage 30 days ago?” The pipeline view always reflects the current state. Once an opportunity moves or closes, that moment in time is gone from view.
For agency owners reviewing client pipelines, ops teams running monthly reporting, and anyone doing quarterly business reviews, this is a real gap. Here’s what causes it and how to work around it.
See your GoHighLevel pipeline as it looked on any past date — automatically. BlinkMetrics captures a daily snapshot of your pipeline, so the history GHL never stored is there when you need it:
- Automatic daily snapshots of every opportunity’s stage, value, owner, and expected close date
- Set any past date and read the pipeline exactly as it stood then — no exports to remember
- Compare two dates, and compare pipeline health across sub-accounts, for client reviews and QBRs
→ See your GoHighLevel pipeline at the start of last month — book a 1:1 with our founder, Nathan
If you’re running GoHighLevel and need this historical view today, BlinkMetrics’ GoHighLevel reporting captures daily pipeline snapshots automatically and lets you query any past date. The rest of this post walks through the manual path and where it breaks down, then shows what the automated approach looks like.
A quick note on GHL “Snapshots” vs. pipeline snapshots
If you searched for “GoHighLevel snapshots,” you may have landed here expecting information about GHL’s Snapshots feature. That feature is something different entirely. In GHL, a Snapshot is an account configuration template that lets you copy automations, pipelines, workflows, and settings from one sub-account to another. It’s a setup and onboarding tool.
What this post covers is a pipeline snapshot: a record of what opportunities were in your pipeline on a specific past date, including their stages, values, and owners at that point in time. GHL doesn’t offer this natively. The two concepts share a name but solve completely different problems.
Why historical GoHighLevel pipeline data matters
Most pipeline questions aren’t about right now. They’re about explaining what happened between two points in time.
Client reviews and agency reporting. If you manage pipelines across multiple sub-accounts for clients, you need to show how each pipeline changed over the reporting period. “Pipeline grew 25% this month” only means something if you can show what it was at the start. Pulling that number from memory or a screenshot you may or may not have taken is not a reliable process.
Forecast reconciliation. You projected $150k closing this quarter from a client’s pipeline. $90k actually closed. To explain the gap, you need to see which opportunities were open at the forecast date, which ones moved forward, and which ones stalled or dropped out. GHL can tell you what closed. It can’t show you what was supposed to close.
Quarterly business reviews. QBRs compare the current quarter against the previous one across several dimensions:
- Pipeline volume by stage
- Average opportunity size
- Conversion rates by stage
- Velocity (how fast opportunities move through stages)
All of these comparisons require knowing what the pipeline looked like at both points in time.
Opportunity velocity analysis. To understand how long opportunities spend in each stage, you need to track stage assignments over time. Current-state data tells you where opportunities are. Historical data tells you how they got there and how long each leg took.
What GoHighLevel’s pipeline reporting actually shows
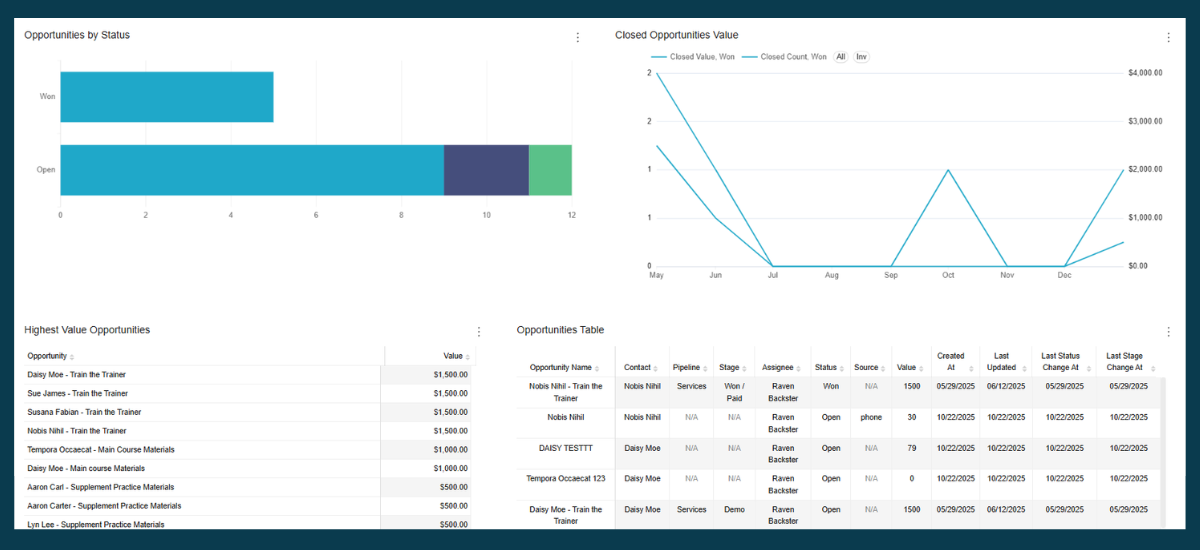
GHL gives you useful reporting within its current-state model. The Reports tab provides:
- Pipeline overview: Open opportunities organized by stage
- Opportunity counts and values: Totals by stage, filterable by pipeline and assigned user
- Closed/Won reporting: Opportunities marked as won within a date range
- Stage conversion rates: Basic funnel view showing how opportunities progress
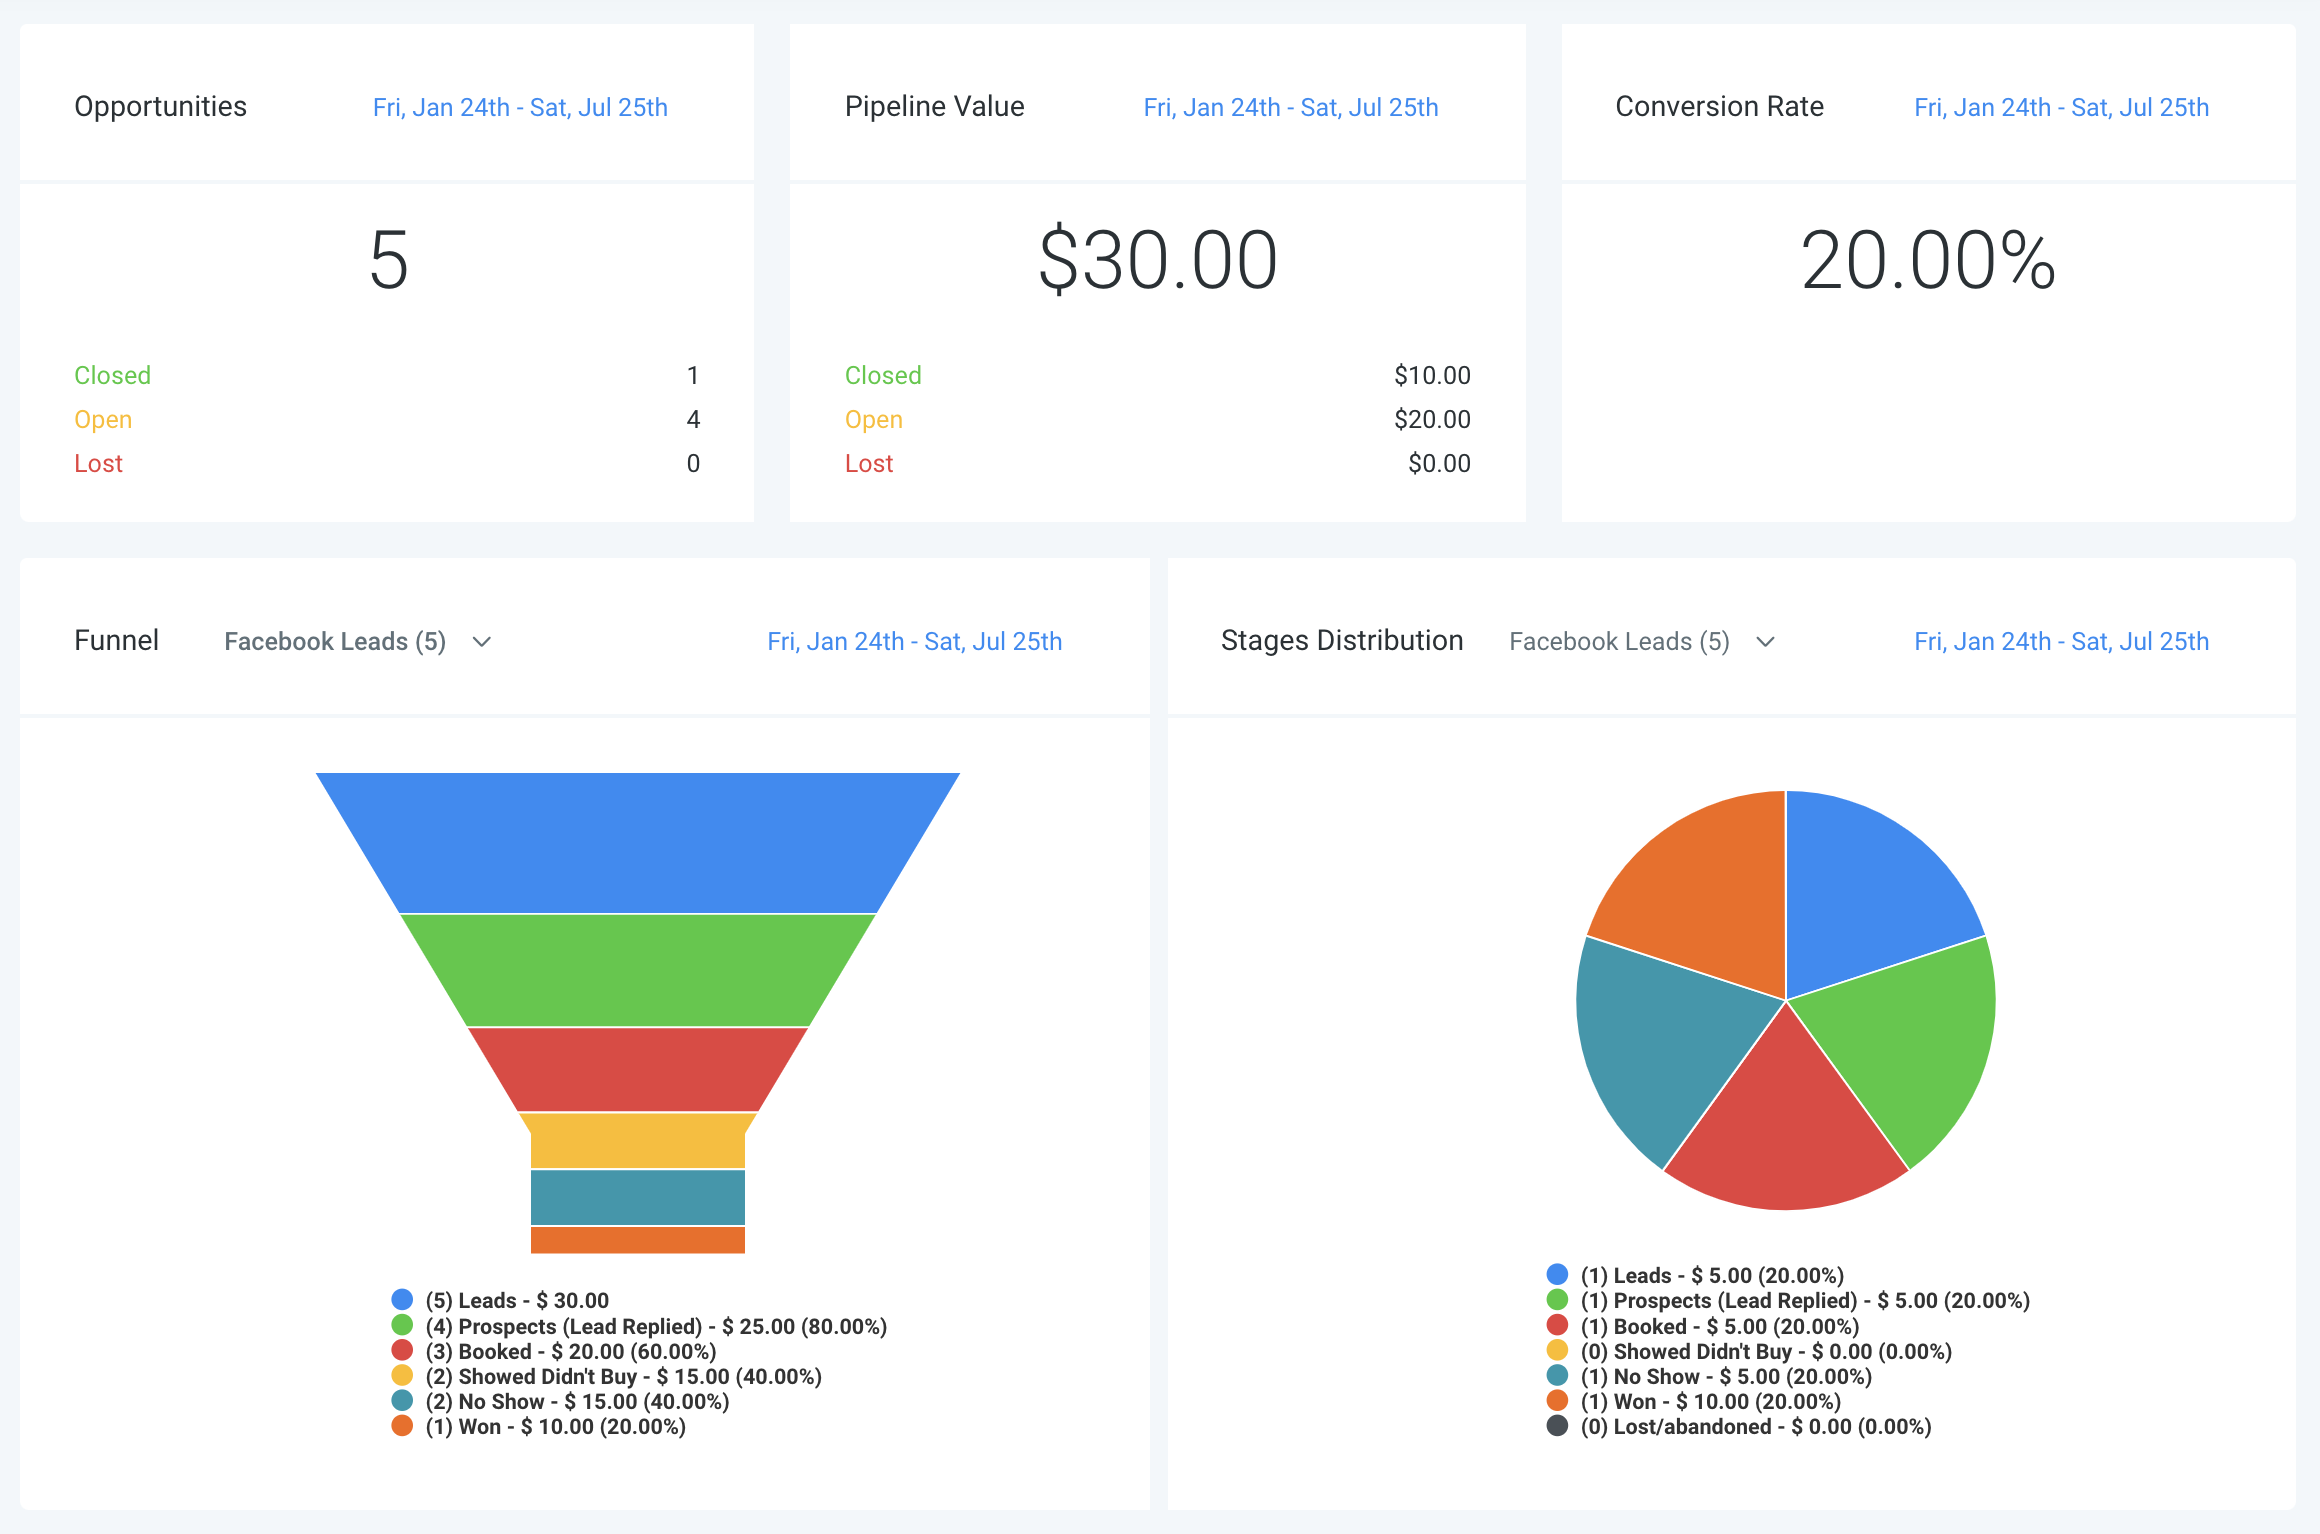
Where GHL falls short is any question that requires a point-in-time view. A “closed in March” report tells you what closed. It doesn’t show you what was open at the start of March or what the conversion rate was for opportunities that entered in March.
GHL’s ideas board has active feature requests for more advanced sales reporting, including forecast and historical views. This is a known gap, not an edge case.
Comparing pipeline health across sub-accounts
This is where the gap becomes especially painful for agencies. If you manage five, ten, or fifty client sub-accounts in GHL, each with its own pipeline, there’s no native way to answer questions like:
- Which client’s pipeline shrank the most this month?
- Which sub-account had the highest close rate last quarter vs. this quarter?
- Where is pipeline velocity slowing down across the book of business?
Each sub-account’s Reports tab shows current-state data for that account only. There’s no cross-account historical comparison built into GHL. You’d need to log into each sub-account individually, export data, and try to reconstruct comparisons manually.
How to get a historical pipeline view from GoHighLevel
There are two approaches. One is manual and requires ongoing discipline. The other uses a reporting tool to automate the process.
Manual pipeline snapshots
Some teams take a manual snapshot on a fixed schedule: export the current opportunity list from GHL (all open opportunities with stage, value, owner, and expected close date) and save it in a dated spreadsheet tab or file.
This works if the process is consistent. The problems are:
- Someone has to remember to do it on the same day each period
- If a snapshot is missed, that period’s data is gone permanently
- Comparing two snapshots requires manual spreadsheet work
- The data is static, so you can’t filter or slice it the way you would a live report
- For agencies, this has to be repeated across every sub-account
Automated pipeline snapshots with a reporting tool
A reporting tool that connects to GoHighLevel and stores periodic snapshots of opportunity state can reproduce the pipeline as it looked on any past date.
BlinkMetrics stores point-in-time snapshots of your GHL pipeline automatically. Set the date filter to any past date and the dashboard shows which opportunities were open, what stage they were in, their values, and their assigned owners at that time.
A practical example: you’re preparing a monthly review for a client. Set the date to the first of last month and you see the pipeline entering the period. Set the date to the last day and you see how it looked at close. Compare the two to show what moved, what closed, and what slipped. No exports, no spreadsheet tabs, no logging into the sub-account and hoping you saved something.
For agencies, this works across sub-accounts from a single view. You can compare pipeline health for Client A and Client B side by side, with historical data for both.
Want to see what your GHL pipeline looked like at the start of last month? Let’s take a look..
What you can do with historical pipeline data
Once you have point-in-time snapshots, several analyses that were previously impossible become straightforward.
Pipeline comparison across periods
| Metric | Month start | Month end | Change |
|---|---|---|---|
| Open opportunities | 28 | 22 | -6 |
| Total pipeline value | $185k | $140k | -$45k |
| Opportunities in Proposal stage | 8 | 5 | -3 |
| Opportunities in Negotiation stage | 4 | 6 | +2 |
This kind of table is easy to build when you have snapshots for both dates. Without them, it requires piecing together close dates and guesswork.
Slippage analysis
Compare opportunities that were in the pipeline at the start of a period against what actually closed. Opportunities that were open but didn’t close either:
- Slipped to a future period (still open, expected close date pushed)
- Fell out entirely (marked lost or deleted)
- Stalled in an early stage without movement
Seeing this pattern consistently for certain opportunity types, stages, or assigned reps helps you adjust how you weight forecasts going forward.
Stage velocity
How long do opportunities spend in each stage, on average? Snapshot data lets you track when an opportunity entered a stage and when it moved, then aggregate across all opportunities.
| Stage | Average days in stage |
|---|---|
| New lead | 3 |
| Appointment booked | 7 |
| Proposal sent | 12 |
| Negotiation | 9 |
| Closed won | — |
If Proposal is consistently the longest stage, that’s where you look to improve conversion speed.
Pipeline value over time
A chart showing total open pipeline value week by week surfaces declines before they appear in closed revenue. If pipeline starts dropping in week two of a month, that shows up in results four to six weeks later. With historical data, you can catch these patterns earlier.
Cross-sub-account comparison
For agencies, the most useful view is often a table like this:
| Sub-account | Pipeline (start of quarter) | Pipeline (end of quarter) | Change | Close rate |
|---|---|---|---|---|
| Client A | $320k | $280k | -12.5% | 22% |
| Client B | $145k | $210k | +44.8% | 35% |
| Client C | $88k | $72k | -18.2% | 18% |
This kind of comparison is only possible with historical snapshots stored for each sub-account. It makes client review meetings significantly more productive because you’re showing real pipeline movement, not just current numbers.
See GoHighLevel pipeline history in action
Daily pipeline snapshots, calculated KPIs, and the historical reporting GoHighLevel doesn’t ship natively, all in a single dashboard. See how BlinkMetrics works with GoHighLevel, or book a 30-minute walkthrough and we’ll show you what your GoHighLevel pipeline looks like with full historical visibility.
Frequently asked questions
Can GoHighLevel show historical pipeline data?
No. GoHighLevel’s pipeline view always reflects the current state of your opportunities. There’s no native way to ask what opportunities were in a given stage on a specific past date. Once an opportunity moves stages or closes, GHL doesn’t provide a way to reconstruct the pipeline as it was before that change. Feature requests for historical reporting exist on GHL’s ideas board but haven’t been addressed with a native solution.
Is a GHL “Snapshot” the same as a pipeline snapshot?
No. In GoHighLevel, a Snapshot is an account configuration template used to copy workflows, automations, pipelines, and settings between sub-accounts. It’s a setup tool for onboarding new clients or standardizing account configurations. A pipeline snapshot, by contrast, is a point-in-time record of what opportunities existed in your pipeline on a specific date. GHL doesn’t create pipeline snapshots natively.
How do I compare GoHighLevel pipeline data across sub-accounts?
GHL’s Reports tab works within a single sub-account. There’s no built-in way to compare pipeline metrics across sub-accounts from a single view. You’d need to manually export data from each sub-account and combine it in a spreadsheet. A reporting tool like BlinkMetrics that connects to GHL can pull data from multiple sub-accounts and present cross-account comparisons with historical context.
How do I see what opportunities were in my GHL pipeline last month?
If you haven’t been exporting your opportunity list on a regular schedule, that data isn’t available from GHL. Going forward, you can either start taking manual exports on a fixed schedule (and saving them in dated files) or use a reporting tool that stores automatic snapshots. With stored snapshots, you can set a date filter to any past date and see the full pipeline as it was.
What is the best way to track GoHighLevel pipeline changes over time?
The most reliable method is automated snapshots taken on a daily or weekly schedule by a reporting tool connected to GHL’s API. Manual exports work but depend on someone remembering to do them consistently. Missed exports mean missing data. Automated snapshots eliminate that risk and allow you to compare any two dates without extra work.