
TL;DR: Asana shows whether an approval task is pending, approved, or rejected. It doesn’t show how long it’s been in each state. When a project timeline slips because an approval has been sitting in someone’s queue for a week, Asana gives you no direct way to see that. To find approval bottlenecks, you need either a manual audit of task ages or a reporting tool that tracks elapsed time per approval.
What an approval bottleneck actually looks like
The symptom is familiar: a project is waiting on an approval that should have been resolved days ago. The deliverable is done, the task is submitted, but it’s waiting on a final sign-off by leadership or another team member so the project can be delivered to the customer.
Common sources:
- One overloaded approver: the same senior person is needed for every team member’s approval and their queue is backed up
- Unclear submission: the task demo or work sent in didn’t give the reviewer what they needed to make a decision, so after an initial look, they pause and leave the review pending for when they ‘have more time’ to dig into it rather than rejecting
- Too many approvers: a task is sent to four people simultaneously for sign-off, and each one assumes the others will go first
- Low urgency signal: the submitter marked the task as normal priority or labeled it with a vague description, so the approver moved on to what appeared more pressing
The problem with diagnosing this in Asana: you can see that approvals are pending, but not how long they’ve been pending. Oldest pending approval is not a sortable, filterable view.
What Asana’s approval workflow shows (and what it doesn’t)
Asana’s approval tasks are real tasks with a special action: the assignee can approve, reject, or request changes instead of just marking complete. This makes them useful for routing work through review steps.
Here’s what’s visible natively:
| What you can see | What you can’t see |
|---|---|
| Whether each approval is pending, approved, or rejected | How long it’s been pending |
| Which tasks are designated as approval type | Approval age sorted by oldest |
| Who the approval is assigned to | Historical average approval time |
| Comments and context on each task | Which approver in a multi-approver task is the hold-up |
Dashboard chart widgets can show task count by status (“12 tasks in review”) but not duration. A bar chart showing approvals pending for 0-2 days, 3-5 days, or 6+ days isn’t something Asana’s dashboard can build.
How to diagnose your approval bottleneck
Even without a dedicated analytics tool, you can get a workable diagnosis with a few manual steps.
Step 1: Get a list of all pending approvals
In Asana, filter your project view by incomplete tasks and look for approval task type. If you’re working across multiple projects, use Advanced Search to find all tasks marked as approval type with an incomplete status.
Step 2: Check task creation dates
Open each pending approval and note the created date. The gap between created date and today is the pending duration. Tasks created more than 5 business days ago with no resolution are your candidates.
Step 3: Look for a pattern in the assignee
If most of the aging approvals belong to the same person, you’ve found the bottleneck. This isn’t always a performance issue. It may simply mean that person is overloaded or the approval flow wasn’t designed with their actual capacity in mind.
Step 4: Check for tasks with “Changes Requested” cycles
Tasks that have been returned for revision and resubmitted add hidden cycle time. A task submitted, rejected, revised, and resubmitted twice looks identical to a freshly submitted task in the pending view. Count the activity history on tasks that feel like they’ve been in review too long.
This process works for small teams with only about 10-20 concurrent approvals. Past that, it stops being practical.
Measuring approval cycle time to find the real bottleneck
The more systematic approach is to measure approval cycle time: the elapsed time from when an approval task is created to when it’s resolved (approved or rejected).
This metric tells you where time actually goes. Average approval cycle time by project, by approver, or by task type will surface the pattern faster than a manual audit.
How to calculate it manually: export approval tasks to CSV, compute completion date - creation date per task, and take the median by approver, project, or month. The full step-by-step (plus SLA targets and how to handle pending approvals) is in our approval cycle time guide.
This is the part we build for you. Approval timestamps already exist on every task in your workspace, so the dashboard calculates cycle time from what’s there. No export, and no new field for anyone to maintain.
Four widgets do most of the diagnostic work:
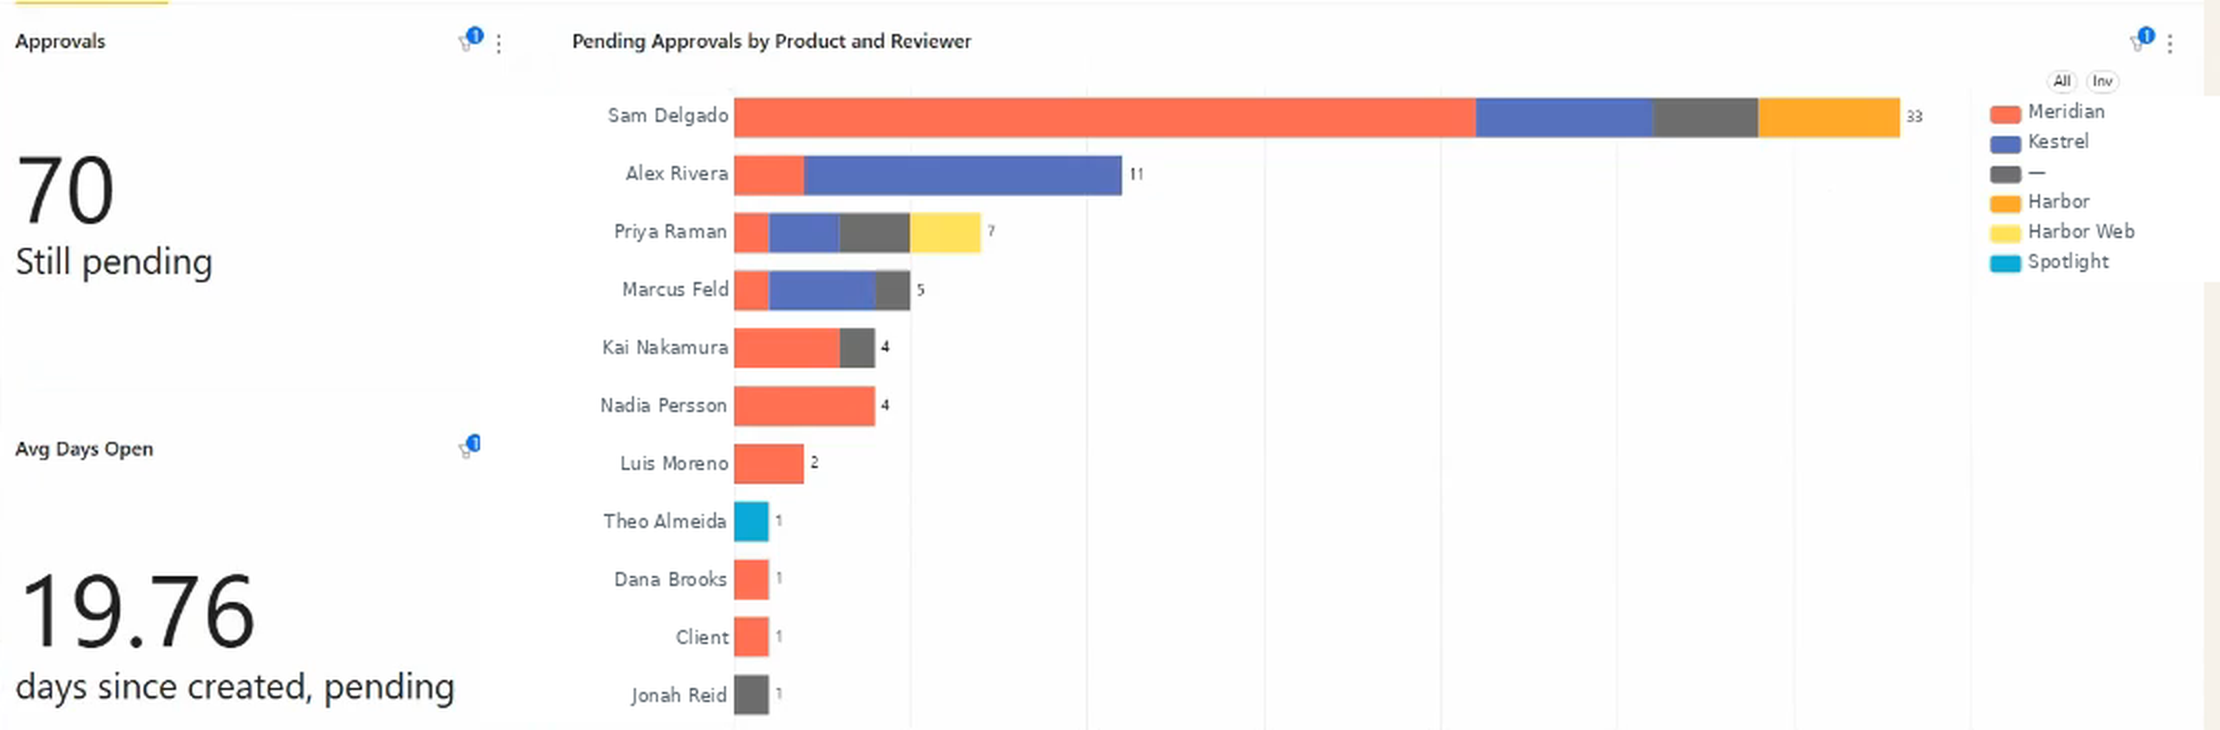
Open approvals by reviewer. The queue, split by who is holding it. Imbalance shows up immediately here, and it’s more common than most teams expect: one person routinely holding several times what anyone else does.
That shape is the common one. Seventy approvals outstanding, and nearly half of them sitting with a single reviewer while most of the team holds one or two. No amount of chasing individual tasks fixes that; it’s a routing problem, and it’s invisible until the queue is drawn per person.
Oldest pending approvals, ranked. The one that finds problems nobody was looking for. Sorted oldest-first, the top of this list is rarely a busy reviewer; it’s usually an approval assigned to someone who has left, or a request so vaguely worded that nobody knew how to action it. Those sit for months and quietly distort every average on the page until someone clears them out. Finding them is as much a data-cleanup job as a bottleneck one.
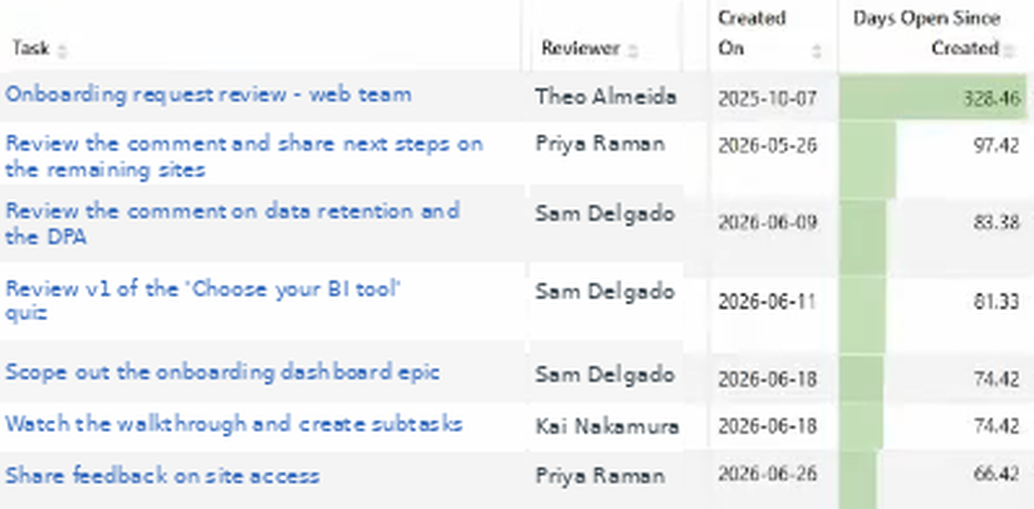
The gap between the first row and the second is the tell. One approval open 328 days, then a drop straight to 97. That top row isn’t a slow reviewer, it’s an item that fell out of the process entirely — and while it sits there it drags the team’s average-days-open upward by itself. Clearing one row like that changes the headline number more than a week of chasing everything else.
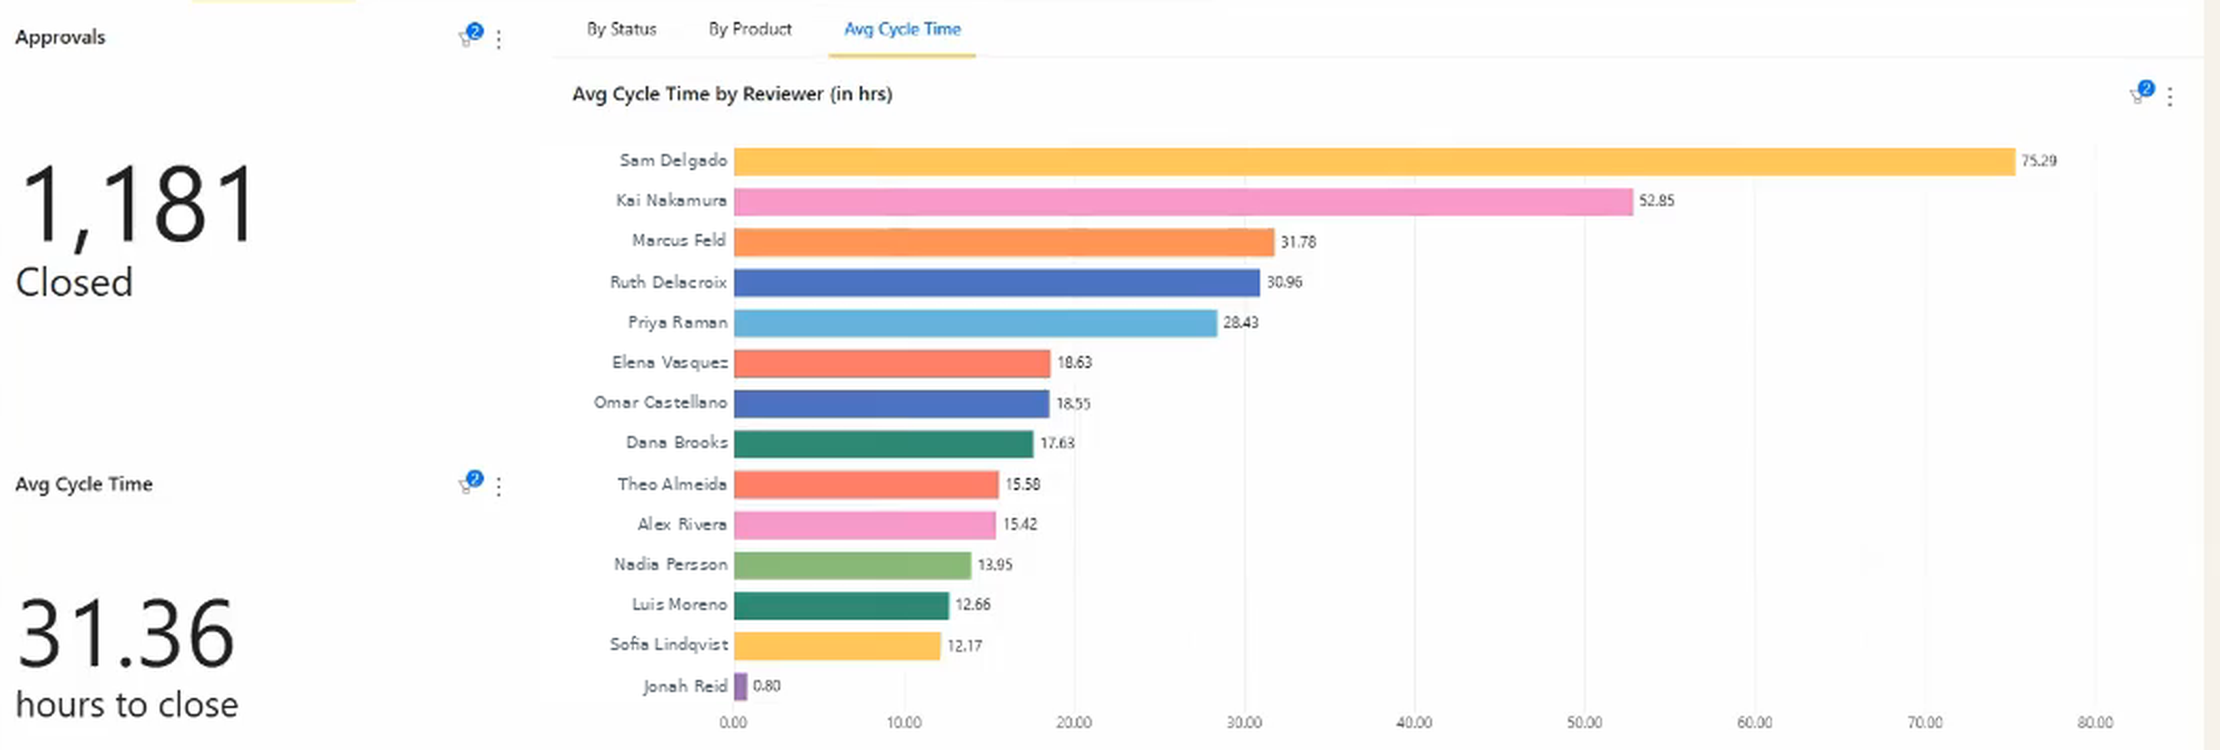
Average cycle time by reviewer. Read against whatever turnaround target you’ve set internally, this is who’s inside it and who isn’t, at a glance.
Share of the queue by product, client, or project. Whether the delay is a person problem or a workload problem. One product line generating most of the review volume is a different fix from one reviewer being slow.
That combination answers the specific question: which team member has the longest average approval cycle time, is it because they’re slow or because they’re buried, and has it improved since last month?
One caveat worth holding onto when you read the per-reviewer chart: whoever receives the most approvals will usually post a longer average, because a deeper queue means everything in it waits longer. Volume and speed have to be read together or you’ll coach the wrong person.
Want to see where your approvals are actually stalling? Book a strategy call with Nathan. He’ll walk you through these views on a live dashboard and how they’d read against your own approval queue.
What to do once you find the bottleneck
Once you know where approvals are stalling, the fix depends on the root cause.
If it’s one overloaded approver: Share the cycle time data with them directly. In most cases, making the delay visible is enough to change behavior if they have the time to deprioritize other activities. If the approval volume genuinely exceeds their capacity, either reduce their approval assignments or add a backup approver to help out.
If tasks keep coming back with “Changes Requested”: The problem is likely at the submission stage, not the review stage. Add a pre-submission checklist to the approval task process: required assets, brief summary, relevant context. Reviewers who have to ask follow-up questions before deciding are reviewers who slow down. See also: tracking revision cycles in Asana.
If there are too many approvers: Audit who actually needs to approve versus who was added for awareness. Asana allows followers on a task without them being required approvers. Move optional sign-offs to followers, not required approvers or if you want to keep the approval, mark it as “FYI” and don’t allow it to block task completion.
After fixing: Re-run the cycle time calculation after 4-6 weeks to verify the change worked. If average approval cycle time dropped, the fix held. If not, keep experimenting with your process.
FAQ
How do I see pending approval age in Asana? Natively, you can’t sort or filter by how long a task has been pending. You’d need to check each approval task’s creation date manually. A reporting tool like BlinkMetrics calculates this automatically from task timestamps.
What is approval cycle time? Approval cycle time is the elapsed time from when an approval task is submitted to when it’s resolved (approved or rejected). It’s the standard metric for measuring how long your approval process actually takes.
How do I fix a bottleneck in my Asana approval workflow? Start by identifying where time is going: one slow approver, unclear demos of work, excessive revision cycles, or too many required approvers. Each cause has a different fix. Measuring cycle time per approver is the fastest way to isolate the cause.
Can Asana show me who is slowing down approvals? Not natively. Asana doesn’t aggregate approval duration by assignee. A reporting tool that calculates cycle time per reviewer can show this, but it requires external processing of Asana’s task timestamps.