
Short answer: Asana doesn’t track how many times an approval task has been rejected or how many revision rounds it went through. The activity log shows the back-and-forth in task comments, but there’s no structured revision count, no aggregate view across a project, and no way to see which tasks have cycled through review the most times.
What revision cycling looks like in practice
The pattern: a task gets submitted for approval, the reviewer requests changes, the creator revises and resubmits, the reviewer requests changes again. Repeat.
From the project view, all of this is invisible. The task shows “Changes Requested” and then “Pending” and then “Changes Requested” again. There’s no badge showing “3rd revision” and no project-level view showing which tasks have the highest revision count.
The downstream effect is hidden schedule slippage. The project appears to be moving because tasks are technically “in review,” but they’re actually cycling. By the time someone notices, the deadline is close.
A few scenarios where this tends to concentrate:
- A specific reviewer with high rejection standards: they reject frequently and the pattern is consistent across tasks
- Unclear briefs: the submission didn’t include what the reviewer needed to make a decision, so they ask for more rather than deciding
- A specific task type: creative briefs, copy drafts, and design files tend to cycle more than project plans or technical specs
The only way to know which scenario is driving your rework is to see the data. And Asana doesn’t surface it.
What Asana’s approval feature tracks (and the gap)
Asana approval tasks have three possible decisions: approve, reject, or request changes. Each of these creates an activity entry in the task log.
Asana logs every status change in the task activity feed, so the raw trail exists for any individual approval. What’s missing is structure: there’s no field for total rejection count, no project-level view ranking tasks by revision depth, no filter for “tasks rejected 3+ times,” and no way to compare bounce-back rates across reviewers. To count revisions, you’d have to open each task and tally the “Changes Requested” entries by hand.
How to manually track revision cycles in Asana
For small teams or low-volume approval workflows, two manual approaches work:
Option 1: Custom “Revision count” field
Add a numeric custom field called “Revision count” to your project. When a task gets returned for changes, the person managing the workflow manually increments the field by 1. Over time, tasks with high numbers become visible in the list view.
Limitation: it depends on someone remembering to update the field every time. Miss it once and the count is wrong.
Option 2: Rejected section
Create a section in your project called “Returned for Revision.” When a task is kicked back, move it there. The section count tells you the volume of rework in the current project.
Limitation: this only shows current state, not history. Once a task is resubmitted and approved, it moves out of that section and the rework is invisible again.
Both approaches work at low volume (10-15 concurrent approvals) with a disciplined team. They break down at scale or when the person managing the workflow is also the person doing the work.
Tracking revision cycles at scale with analytics
The structured approach is to track bounce-back rate: the percentage of approval tasks that were rejected at least once before reaching a final approved or rejected state.
This metric answers: how much of our approval work goes through at least one revision cycle?
It also enables comparisons: which reviewer has the highest bounce-back rate? Which task type generates the most rework? Has the rate been improving or getting worse?
This is the part we build for you, and it comes in two pieces.
A change-request count on every task. Each approval carries the number of times it has come back, sitting in the same table as its status, priority, and age. A task showing five rounds while still open is doing something no status field would ever tell you. That’s not a task in review, that’s a task in trouble, and it reads as one at a glance.

The column on the right is the whole idea. Every other column here exists in Asana somewhere; the count of times each item has been sent back does not. Sitting next to days-open, it separates work that is genuinely complex from work that is simply stuck in a loop — the top row has been open 28 days across four rounds, which is a different problem from 28 days across one.
A threshold list of everything over the line. Rather than ranking all work by rework, the more useful view is an exception list: every approval that has gone more than N rounds, with N set to whatever your team considers too much. Three is a reasonable starting point, and it’s the number we use on our own board. Set it higher if your work genuinely warrants more iteration, lower if you’re tightening first-pass quality. It’s a decision made once, when the view is built, rather than a dial anyone fiddles with week to week, and the list stays short enough to actually read. Sorting it by round count puts the worst offenders on top.
That list can then be cut by reviewer, by product or client, and by work type, which is what turns it from a list of annoying tasks into a diagnosis. Rework concentrated in one reviewer is a standards conversation. Rework concentrated in one product line is usually a brief or scoping problem. Rework spread evenly across everything is a process problem.
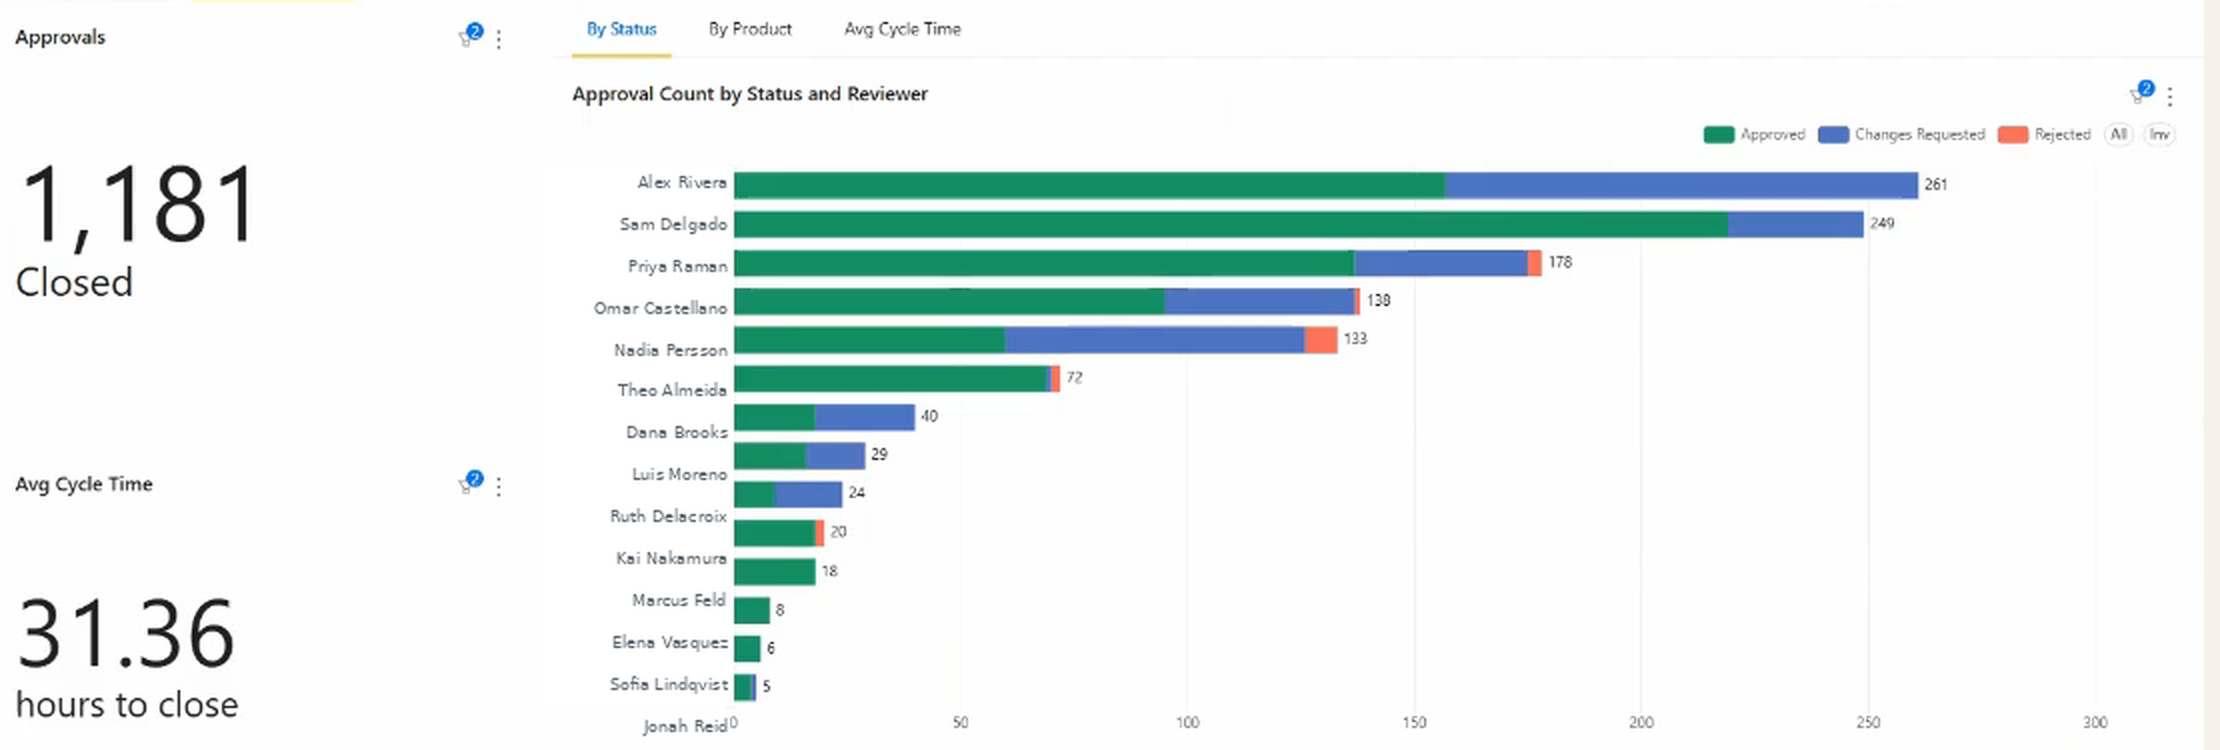
Alongside it, the decision breakdown for the period (how many approvals were approved outright, how many came back as changes requested, how many were rejected) gives you the trend the exception list can’t. The goal most teams are steering toward is a rising share of first-pass approvals, because every avoided round is time two people get back.
Split per reviewer, the same data answers a sharper question. Two reviewers here send back roughly half of what they receive; others approve almost everything first time. Neither pattern is automatically wrong, but the gap between them is worth understanding, and it’s invisible in a single team-wide rework percentage.
Use case: if one reviewer’s work comes back at several times the rate of anyone else’s, that’s a data point worth a direct conversation. The discussion shifts from “you reject everything” (a personal complaint) to “these tasks come back for revision far more often than the team norm, and here they are” (an observation about a pattern, with the list attached).
Want to find out which tasks keep cycling and which reviewer is driving the rework? Schedule a demo with Nathan. He’ll show you the rework views running on a live dashboard and how they’d apply to your approvals.
Rejected and “changes requested” are not the same signal
Asana gives reviewers three outcomes, and teams that use all three get much better data than teams that collapse them into two.
A useful convention: rejected means what came back was not close to what was asked for: wrong direction, wrong scope, start again. Changes requested means the work was broadly right and needs revisions. Kept separate, the two tell you different things. A rising rejection rate points at briefing and alignment, because people are producing the wrong thing. A rising changes-requested rate points at polish and standards, because people are producing roughly the right thing and not finishing it.
If your team uses “rejected” for everything, or never uses it at all, both signals collapse into one number and you lose the ability to tell those two problems apart.
Fixing the rework cycle once you can see it
If rework is concentrated in one reviewer: Share the bounce-back rate data and have a conversation about what “ready to review” means. High rejection rates sometimes reflect genuine quality issues with submissions. Sometimes they reflect unclear standards. The data opens the conversation without making it personal.
If rework is concentrated in specific task types: Add a pre-submission checklist to that task type’s template. For creative reviews, that might mean required files, resolution specs, and a brief summary of the concept. For copy reviews, it might mean the brief reference, audience, and the goal the piece is meant to achieve.
If briefs are unclear: Require a brief field in the approval task that describes what decision the reviewer needs to make. Vague submissions produce vague feedback, which leads to revision loops.
After fixing: Track whether bounce-back rate drops over the next 4-6 weeks. If it does, the fix worked. If it doesn’t, something else is driving the rework and the data will help you narrow it down.
FAQ
Can Asana track how many times a task was rejected? Not natively. Asana logs status changes in the task activity, but there’s no structured revision count field and no way to compare revision depth across tasks.
How do I see rejection history for a task in Asana? Open the task and scroll through the activity log. Each “Changes Requested” or “Rejected” entry represents one revision cycle. The log is per-task and not reportable in aggregate without a third-party tool.
What causes tasks to keep getting rejected in Asana? The most common causes are unclear submission briefs (the reviewer doesn’t have what they need to decide), high reviewer standards that aren’t communicated to submitters, or a misalignment between what the submitter thinks is “done” and what the reviewer needs to approve.
What is a bounce-back rate for approvals? Bounce-back rate is the percentage of approval tasks that received at least one “Changes Requested” or “Rejected” decision before reaching a final approved state. A rate above 30-40% usually signals a process problem worth investigating.
How many revision rounds is too many? There’s no universal number, which is why it’s worth setting one deliberately. Three rounds is a common threshold: past that, the cost of the back-and-forth usually exceeds whatever quality the extra round adds. Pick the number that fits your work, then track everything above it as an exception rather than trying to eliminate rework entirely.
Related reading: how to find approval bottlenecks in Asana and tracking approval cycle time in Asana.