
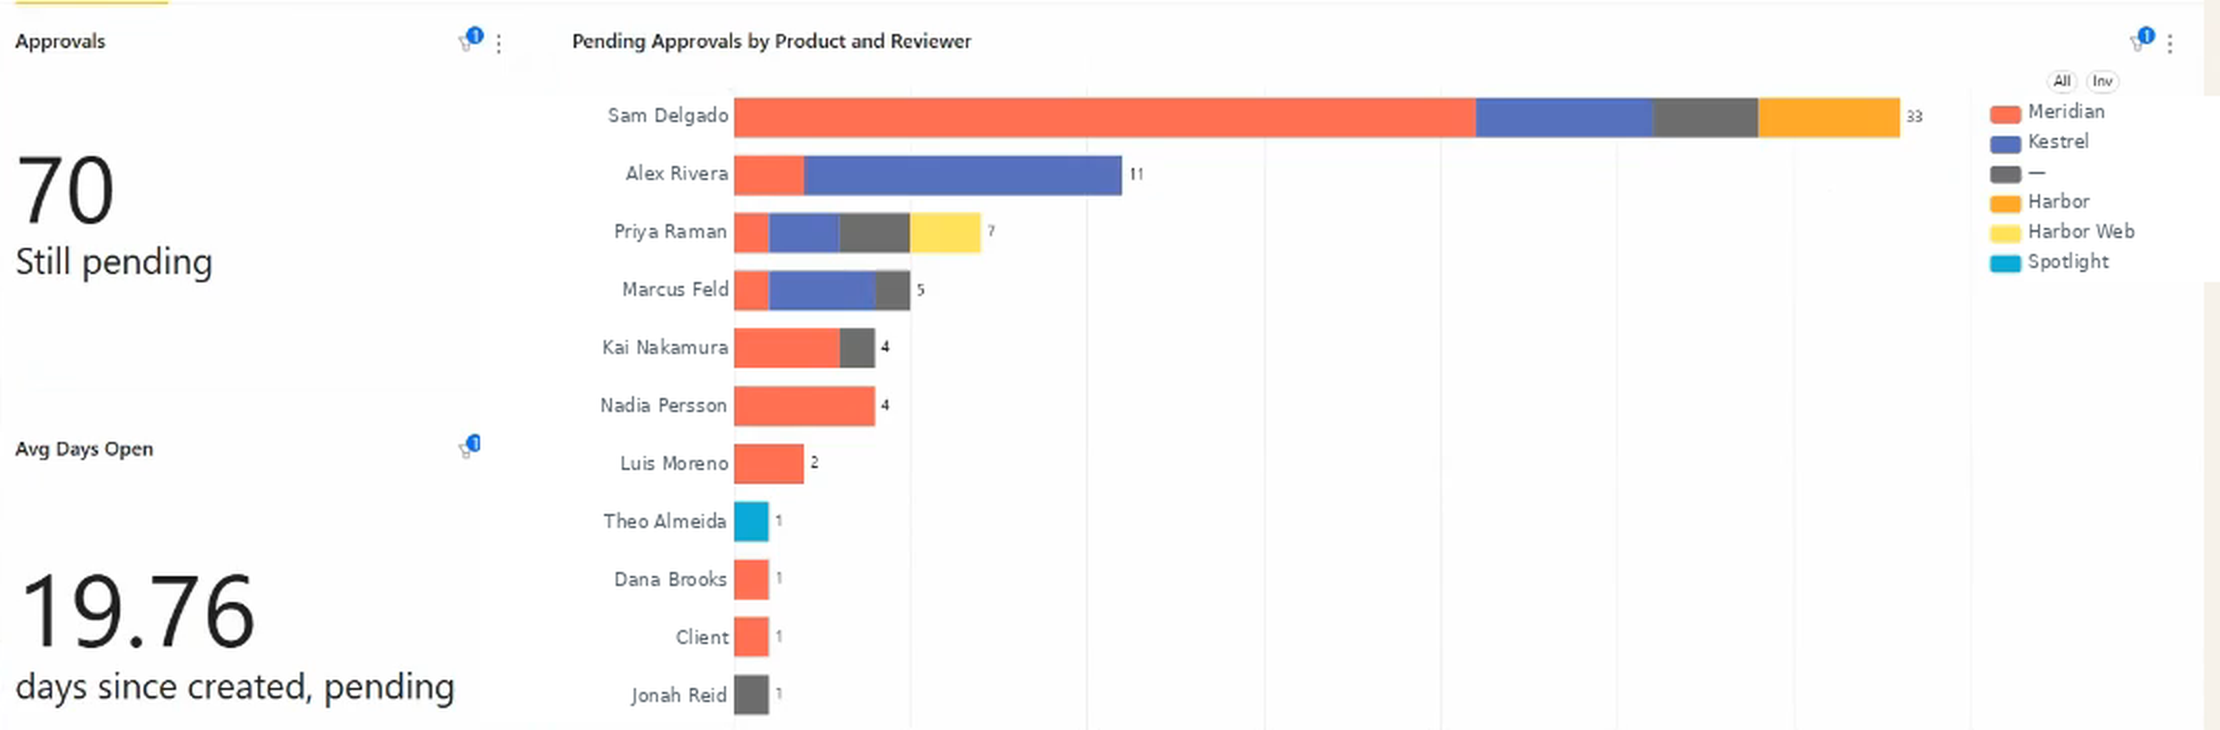
Short answer: Asana approval tasks show status (pending, approved, rejected) but not duration. There is no native metric for how long an approval took from submission to decision. Getting approval cycle time requires either a manual CSV export and spreadsheet calculation or a reporting dashboard that reads Asana task timestamps and calculates it for you.
What approval cycle time is (and why teams measure it)
Approval cycle time is the elapsed time from when an approval task is created (or submitted) to when it reaches a final decision: approved or rejected.
It’s distinct from approval status. Status tells you where an approval currently stands. Cycle time tells you how long each step actually takes.
Teams measure it for three reasons:
Making bottlenecks visible. If your average approval cycle time is 9 days, something is wrong. That number is hard to argue with. It also shows where the time is going: if legal review averages 14 days but design review averages 2, you know where to focus.
Setting SLAs. Once you have a baseline, you can establish targets. A creative review SLA of 48 business hours is meaningful only if you’re measuring whether you’re hitting it.
Coaching slow approvers. Cycle time by reviewer surfaces the pattern without relying on anecdotes. Sharing that one reviewer’s average is 11 days versus the team average of 3 days opens a conversation grounded in data rather than frustration.
Owner and reviewer are two different questions
Before measuring anything, it’s worth being precise about whose time you’re measuring, because approval tasks have two people attached and they answer different questions.
The owner is the person who did the work and sent it for review. The reviewer is the person the approval is assigned to. “How long did Dana wait for her work to be approved?” and “How long does Dana take to review other people’s work?” are both legitimate questions, and they need the data grouped differently.
Reporting that only groups by one of them will answer half your questions and quietly mislead you on the other half. Any cycle time view worth building lets you switch between the two.
What Asana shows for approval tasks
Asana records these data points for every task, including approval tasks:
- Created date
- Completed date (when the approval decision was made)
- Current status (pending, approved, rejected, changes requested)
- Activity log with timestamps for each status change
From those two dates, you can calculate cycle time for any individual task: completion date minus creation date. The problem is doing this at scale.
Asana’s dashboard widgets don’t calculate duration. There’s no chart for “average days to approve, by reviewer.” There’s no filter for “approvals that took more than 5 days.” The data exists in Asana’s records, but nothing surfaces it as a metric without an extra step.
How to calculate approval cycle time manually in Asana
For teams with low approval volume, the CSV export approach is workable:
- In Asana, filter your project for approval tasks and export to CSV (include completed date and created date in the export)
- Open the CSV in a spreadsheet
- For completed approvals, calculate:
completion date - creation date - Calculate median cycle time (use median rather than mean; one very slow approval skews the average significantly)
- Group by reviewer, project, or month to see where time is concentrated
A few practical notes:
- Include only tasks with a final decision (approved or rejected). Tasks still in “changes requested” are still in progress.
- For pending approvals, you can calculate a current age:
today - creation date. This shows which open approvals are overdue. - Repeat monthly to track whether cycle time is improving.
For teams running fewer than 50 approvals per month, this is manageable. Past that, it becomes a dedicated recurring effort.
Tracking approval cycle time on a dashboard
This is the part we build for you. Cycle time comes from the creation and completion timestamps Asana already records on every approval task, so nothing new has to be tracked by hand.
The view splits into two halves, and both matter.
The current state: what’s open right now
The operational half. How many approvals are outstanding, who is holding them, and how long they have been sitting:
- Total open approvals, for whatever scope you’ve filtered to
- Open approvals by reviewer, which is usually where an imbalance becomes obvious. One person carrying most of the queue is a common and fixable pattern.
- Share of the queue by product, client, or project, so you can see whether one line of work generates disproportionate review load
- Average days open across everything outstanding
- The oldest pending approvals, ranked, which is the single most useful widget on the page
That last one earns its keep by surfacing things nobody would otherwise find. An approval created ten months ago and never resolved isn’t a bottleneck so much as a data-quality problem: often a task assigned to someone who has since left, or a vague request nobody knew how to action. Either way it’s distorting every average on the page until someone deals with it, and it only becomes visible when the list is sorted oldest-first.
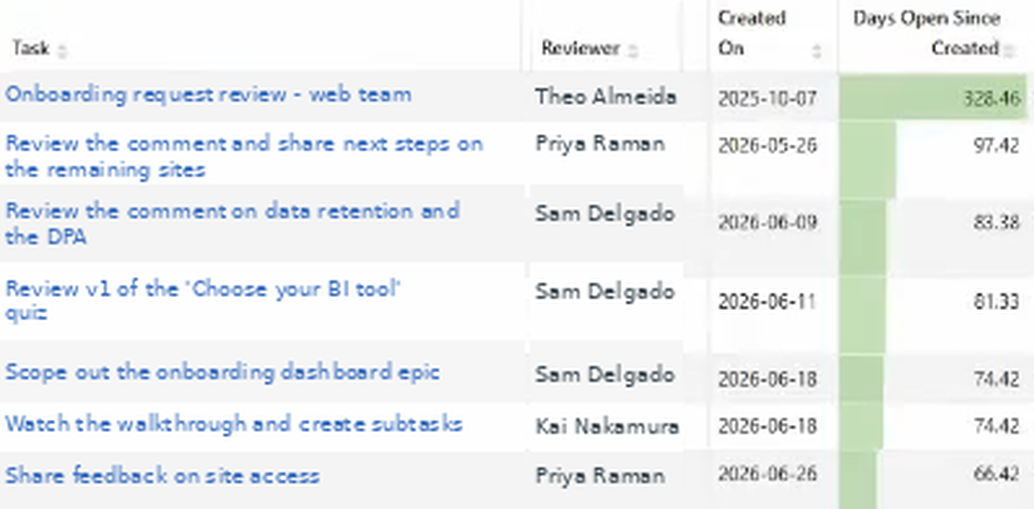
The gap between the first row and the second is the tell: one item open 328 days, then a drop straight to 97.
There’s a per-reviewer version of the same list, which is the one reviewers actually use themselves: what do I owe people, and what has been waiting longest?
The historical view: are we getting faster?
The management half, calculated over a date range you choose:
- Approvals closed in the period
- Average cycle time, in hours or days
- Cycle time you can hold against your SLA. This is the number that makes the rest actionable. Whatever target you’ve committed to internally, 24 hours or 48 business hours or something else, an average you can actually see turns it from a stated intention into something measurable, overall and per reviewer.
- Decision breakdown: how many were approved, how many came back as changes requested, how many were rejected outright
- Cycle time by reviewer, ranked. Read against your target, it’s the fastest way to see who is comfortably inside it and who isn’t.
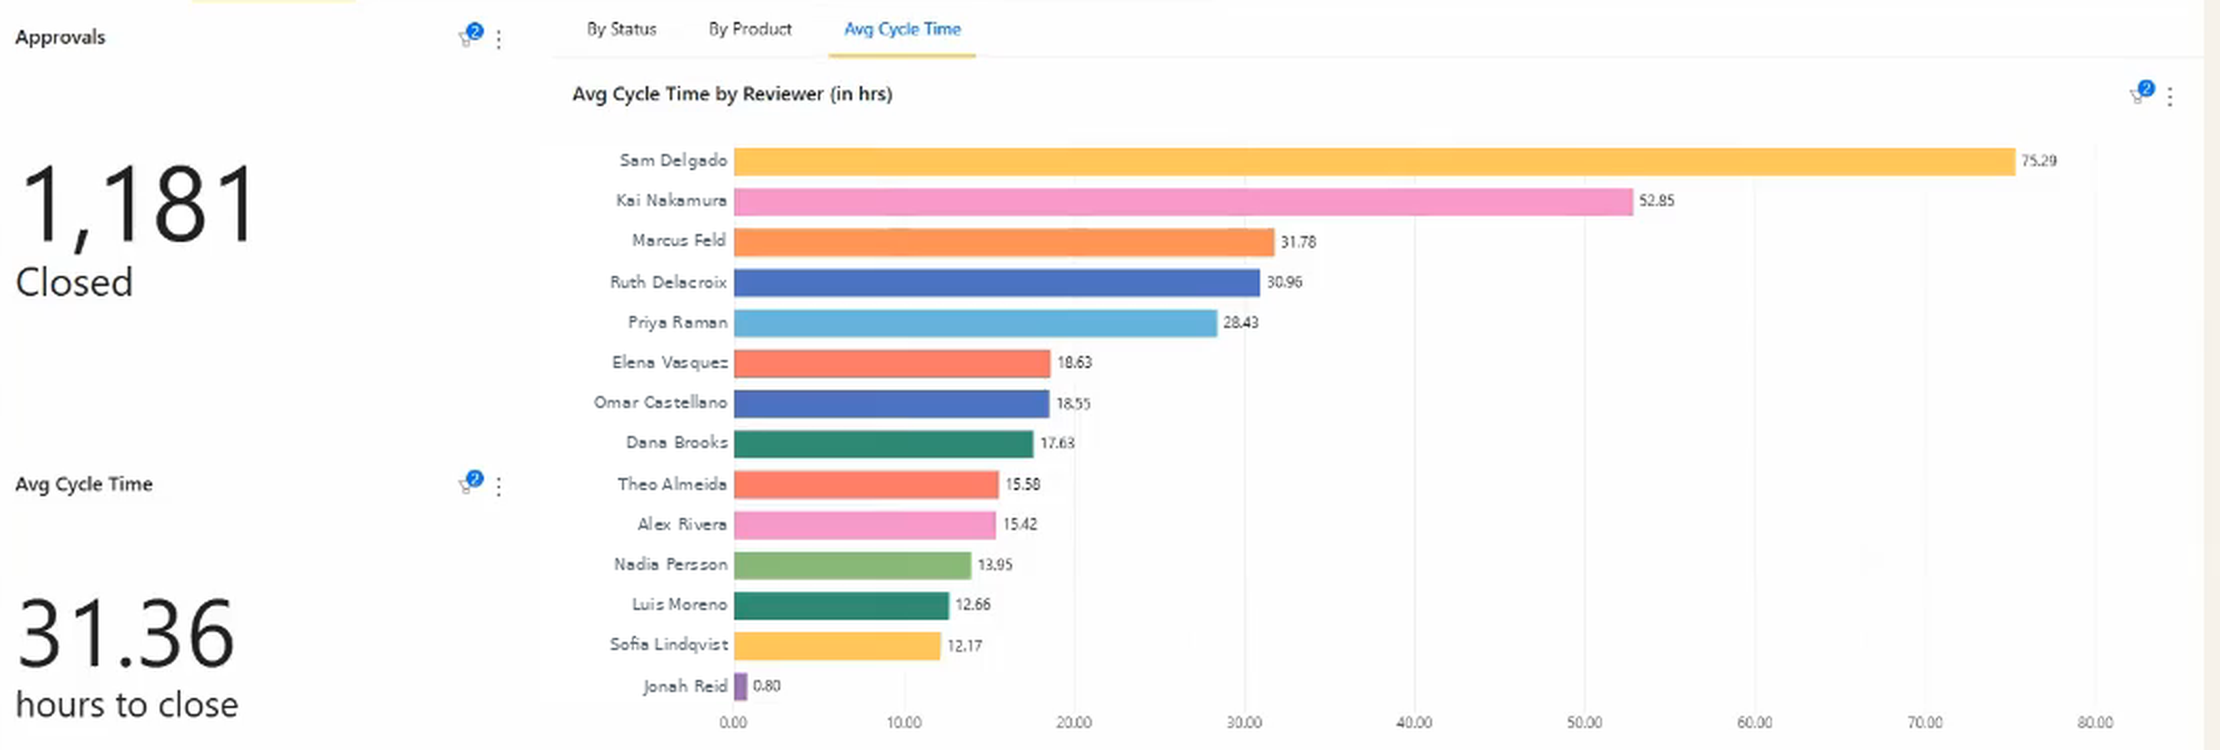
Against a 24-hour target, that chart sorts the team into three groups in about two seconds: the two reviewers well past it, the cluster sitting just above, and everyone comfortably inside. Note the team average of 31.36 hours sitting beside it — the average alone would have told you the target was being missed, but not by whom.
- Reviewer by product, which usually shows that review load is specialised: one person handles most of one product line, someone else handles another. Useful when you’re deciding where a backup reviewer would actually help.
- Closed approvals sorted by longest cycle time, so the outliers can be opened and understood rather than averaged away
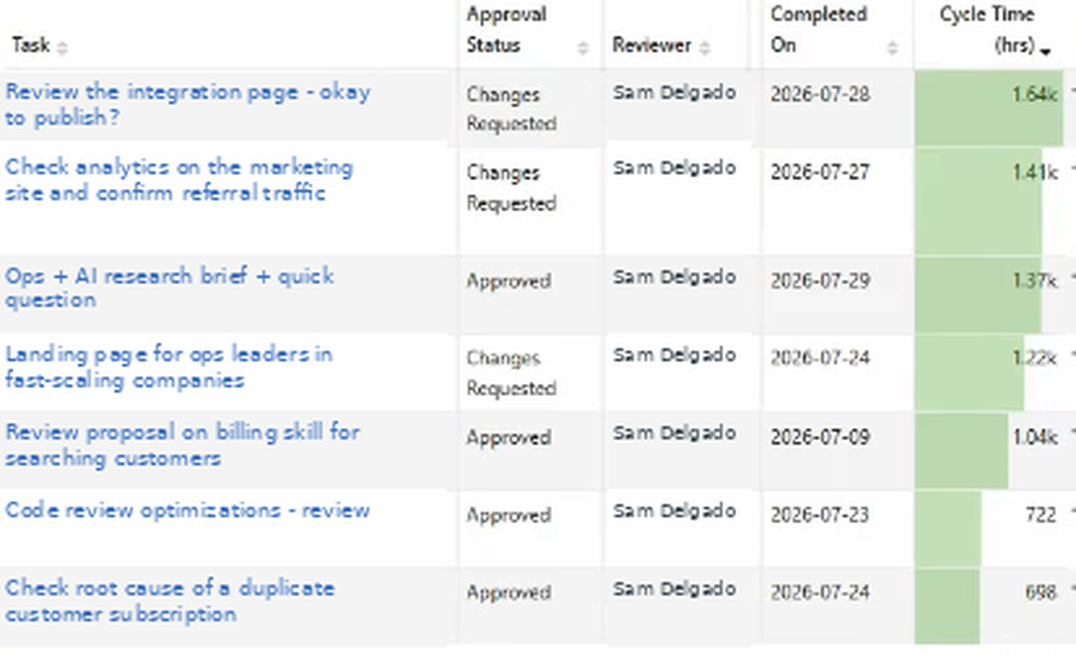
Sorting descending is what makes this useful. The team average is 31 hours; the top row took over 1,600. Those outliers aren’t representative, which is exactly why they’re worth opening — and notice how many of the slowest ones carry changes requested rather than a straight approval. The delay usually isn’t the reviewer thinking, it’s the work going back and forth.
A note on reading the per-reviewer chart: someone can appear at the top for entirely defensible reasons. The person who receives several times the review volume of anyone else will usually have a longer average, simply because a deeper queue means everything waits longer. Volume and speed have to be read together, which is why both live on the same page.
Want your approval SLA at a glance (average cycle time, who is over target, and what’s been pending longest) without exporting CSVs every month? Book a strategy call with Nathan. He’ll show you the approvals views running on a live dashboard and what it would take to point them at your workspace.
Using cycle time data: setting SLAs and coaching approvers
Once you have a baseline, the data becomes a management tool.
Setting SLAs: Run 6-8 weeks of data before setting a target. The baseline tells you what’s realistic. Setting a 24-hour SLA when your current median is 8 days creates a target that’s immediately missed. A more productive path: set a target at the 50th percentile of current performance and work toward the 25th.
Example SLA targets by approval type (rough benchmarks, calibrate to your context):
| Approval type | Reasonable SLA target |
|---|---|
| Creative asset review | 48 business hours |
| Copy review | 24 business hours |
| Legal or compliance review | 5 business days |
| Executive sign-off | 24 business hours |
Coaching approvers: When cycle time data shows one reviewer at 12 days average and everyone else at 3, the conversation changes. Instead of “you’re slow,” the data supports “your approvals are averaging 4x the team median, and that’s contributing to project delays.” That’s a more productive conversation.
Share the data before the conversation, not during. Giving someone a chance to review their own metrics before discussing them reduces defensiveness.
After fixing: Set a reminder to re-run the cycle time calculation 4-6 weeks after making a change. If cycle time drops, the fix worked. If it doesn’t, the root cause is elsewhere and the data will help narrow it down.
FAQ
How do I measure approval turnaround time in Asana? Manually: export approval tasks to CSV, calculate completion date minus creation date per task. Automatically: a reporting dashboard calculates this from Asana task timestamps without any export.
What is a good approval cycle time target? It depends on the approval type and your organization. Creative reviews often target 48 hours. Legal reviews typically need 5+ business days. The most useful target is one based on your own baseline data rather than an industry benchmark.
Can I track approvals against an SLA in Asana? Not natively. Asana has no concept of an approval SLA and no duration metric to compare against one. On a reporting dashboard the target is a value you set, and actual cycle time gets measured against it per reviewer, which is what turns an SLA from a stated intention into something you can manage.
Can Asana send alerts for overdue approvals? Yes, with some setup. Asana’s rules feature lets you create an automation that adds a comment or notifies a specific person when a task has been in approval for more than X days. This requires building a rule per project and doesn’t give you aggregate reporting, but it’s a useful early warning for individual tasks.
How is approval cycle time different from finding an approval bottleneck? Approval cycle time is the metric. Finding the bottleneck is the analysis you do with that metric. Cycle time tells you how long approvals take on average and by reviewer. The bottleneck analysis uses that data to identify where the problem is concentrated. See also: how to find approval bottlenecks in Asana.
Related reading: how to find approval bottlenecks in Asana, why your Asana approvals keep coming back, and how to see who’s handling the most approvals.