
Short answer: Asana records task creation dates and completion dates, but has no native metric that calculates the gap between them. Cycle time (how long tasks take from start to done) requires either a manual CSV export and spreadsheet calculation or a reporting dashboard that computes duration per task and surfaces average cycle time over time.
Cycle time and lead time: a working definition
Cycle time and lead time are often used interchangeably, but they measure different starting points.
- Lead time: elapsed time from when the task was created (or requested) to when it was completed. This includes any time the task sat in the backlog before work started.
- Cycle time: elapsed time from when work actually began on the task to when it was completed. This excludes backlog wait time.
For most Asana-based teams, this distinction matters less than it does in manufacturing or DevOps contexts, because Asana doesn’t have a formal “work started” event by default. There’s no native “In Progress” state change that Asana can timestamp.
In practice, most teams using Asana calculate lead time (creation to completion) and call it cycle time. If you use a status field to track task stages, you can calculate the time spent in each stage, which gives you a more granular cycle time. But the basic version uses creation and completion dates.
What Asana records about task timing
Asana stores these timing data points for every task:
- Created date: when the task was first created
- Completed date: when the task was marked complete
- Due date: the target date (set manually; doesn’t update when the task is actually completed)
- Activity log: a timestamped log of every status change, comment, and field update
From created date and completed date alone, you can calculate lead time for any individual completed task. The information is there.
What Asana’s dashboard doesn’t have is a “duration” metric. Chart widgets can show task count by status, tasks completed per week, or tasks by assignee. None of them calculate or display elapsed time.
A few other timing features worth knowing:
Time Tracking integration: Asana’s paid plans allow time-tracking integrations that log actual time worked on a task. This is different from cycle time; it measures effort, not elapsed calendar time.
Custom rules: advanced users can create rules that write the current timestamp to a custom field when a task moves to a specific status. This creates a workable “time entered status” field that enables cycle time calculation between stages, but it requires setup and doesn’t backfill historical tasks.
Manual cycle time calculation in Asana
For teams that want cycle time data without a reporting dashboard:
- Export the project to CSV from Asana (the export includes created date and completed date for each task)
- Open the CSV in a spreadsheet
- For completed tasks, calculate:
completed_date - created_date - Use median rather than mean for your summary. A single task that sat in the backlog for 60 days before being completed will skew the mean significantly. Median gives a more accurate picture of typical duration.
- Calculate cycle time by section (task type), by assignee, and by month to see where time concentrates
A few practical considerations:
- Include only tasks with both a created date and a completed date. Tasks that were completed without going through normal work (e.g., closed as duplicate) may distort the numbers.
- For open tasks, calculate current age:
today - created_date. This shows you which in-progress tasks have been open the longest. - Re-export monthly if you want a trend view.
For teams with 20-30 completed tasks per month, this process takes about 20 minutes. For teams completing 100+ tasks per month or running multiple concurrent projects, it becomes a significant recurring overhead.
Measuring cycle time continuously on a dashboard
This is the part we build for you. Cycle time is calculated from the task creation and completion timestamps already sitting in your Asana workspace, so there’s no new field to maintain and no export step.
On the dashboards we build, cycle time shows up in three places.
As a headline number. Average days from created to completed for whatever you currently have filtered, sitting next to the completed-task count for the same scope. Change the filter and both numbers move together.
As a dimension you can slice. The same average, broken out by:
- Assignee: whose tasks tend to sit longest before closing
- Product, client, or any other custom field: which lines of work move quickly and which stall
- Task type: bug fixes and feature work rarely have the same natural duration
- Priority: whether your most important work is actually moving faster than everything else
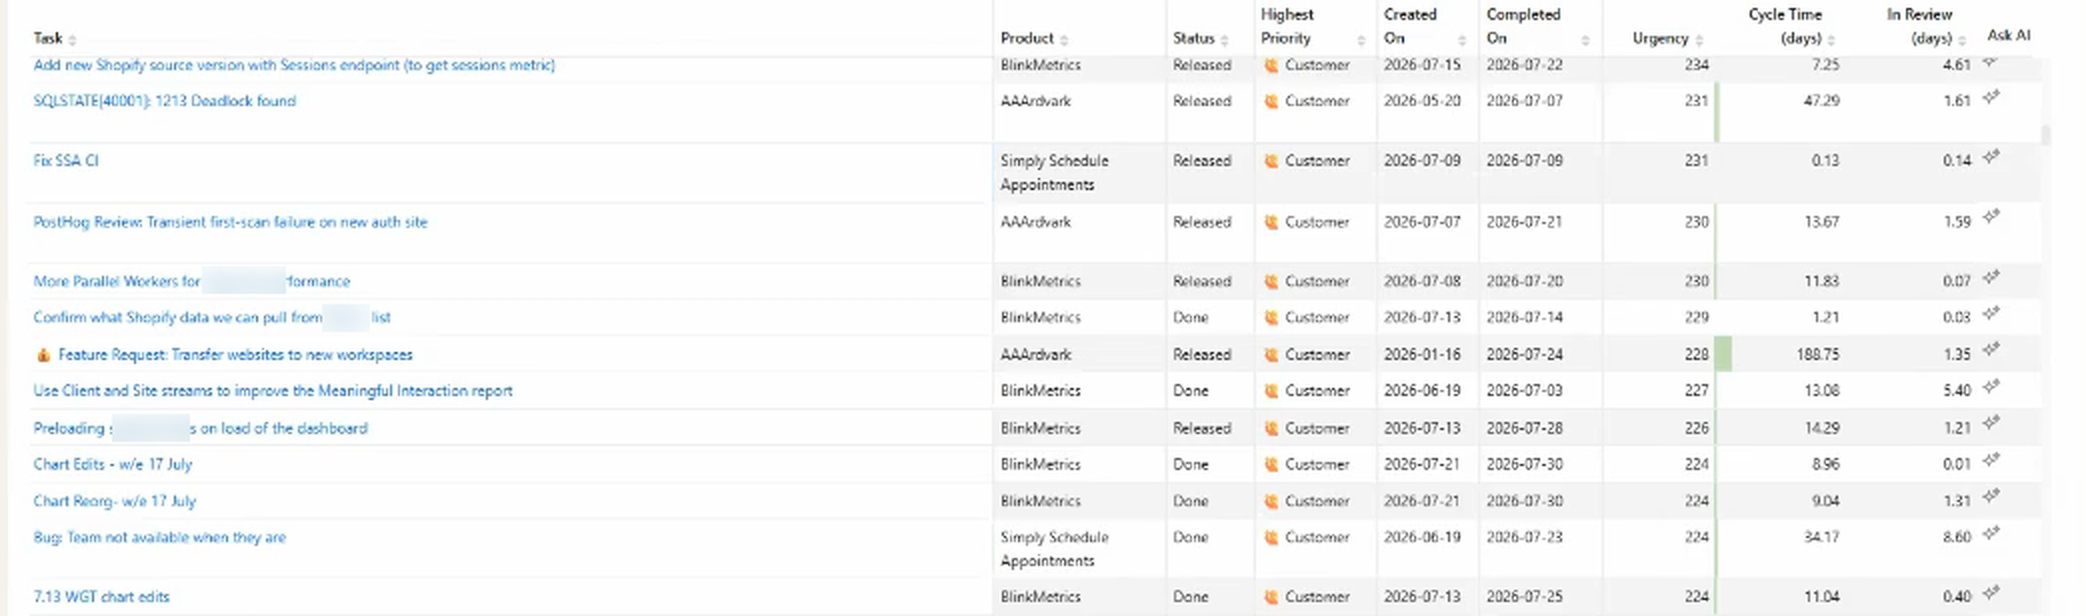
As per-task detail. Underneath the charts, the actual task list: title, status, created date, completed date, cycle days, assignee, and a link straight back into Asana. When an average looks wrong, this is where you find out which specific tasks are driving it.
Two things that table makes obvious at a glance. Cycle time varies enormously between tasks that look similar from the outside, so any single average is hiding a wide spread. And a separate in review column splits waiting-for-a-human out of the total, which is usually where the surprise is.
Scoping it to the question you’re asking
Every one of those views responds to the same filter set, so you’re not maintaining a separate chart per question:
- Completion date range (last week, last month, last quarter, or a custom range)
- Assignee, one or several
- Any custom field you already use: product, client, work type, priority
- Task type: tasks, milestones, or approvals
- Project or portfolio, so cycle time can span every project in a portfolio rather than one at a time
- One-time vs. recurring, so routine admin tasks don’t drag the average around
Watching for long-running open work
Cycle time only counts tasks that finished. The tasks that never finish are the ones worth catching, so the same dashboards track days open on work that’s still in progress, sorted longest-first. A task sitting open far past your typical cycle time is either blocked, forgotten, or badly scoped, and all three are worth knowing about before someone asks for a status update.

Ranking by urgency rather than age puts the same idea to work. Every row showing N/A for cycle time is still open, which makes the gaps easy to spot: the most urgent item on the list has no completion date at all.
The two duration columns are worth reading together on the rows that did finish. Cycle time is the whole journey; in review is the slice spent waiting on a person. One row took 97 days end to end with 11 of them in review, another took 19 days with 26 in review — the second number can exceed the first when work bounces back more than once. Splitting them tells you whether your delay is in the doing or the waiting, and those have completely different fixes.
Use case: if average cycle time jumps from 3 days to 8 days between months, something changed. Maybe a large, complex project came in. Maybe a key team member was out. Maybe the backlog quality dropped. The trend view surfaces the change; the per-task detail underneath provides the explanation.
Want to see task cycle time across your projects with a trend line, without exporting spreadsheets every sprint? Schedule a call with Nathan. He’ll walk you through cycle time on a live dashboard and how it would read for your projects.
Using cycle time for estimation and planning
Cycle time data becomes a planning tool once you have enough history.
Estimation: if your typical cycle time for feature tasks is 4 days, building a sprint plan that assumes completing 5 feature tasks in 3 days is a mismatch. Cycle time gives estimation a data foundation instead of intuition.
Sprint capacity: pair cycle time with completion volume. Volume tells you how much gets done per sprint. Cycle time tells you how long individual tasks take. If volume is stable but cycle time is increasing, the team may be taking on fewer but larger tasks.
Identifying blockers: tasks with unusually long cycle times often have a common cause: a specific external dependency, a bottleneck in the review process, or a task type that consistently gets stuck. Sorting by cycle time surfaces these candidates for investigation.
Improvement tracking: after changing a process (a new brief template, a shorter review cycle, a scope constraint), track whether cycle time changes. If it drops, the change had the expected effect.
FAQ
What is cycle time in project management? Cycle time is the elapsed time from when work starts on a task to when it’s done. In most Asana setups, this is approximated as the time from task creation to task completion, since Asana doesn’t have a formal “work started” timestamp by default.
How do I calculate cycle time in Asana? Manually: export tasks to CSV, calculate completion date minus creation date, use median. Automatically: a reporting dashboard reads those same task timestamps and calculates cycle time per task without any export.
What’s the difference between cycle time and lead time? Lead time includes backlog wait time (from task creation to completion). Cycle time starts when work begins, excluding wait time. Most Asana teams use creation date as the start point for both, making them effectively the same unless you track a specific “work started” custom field.
Can I see cycle time by assignee in Asana? Not natively. Asana has no duration metric to group by. On a reporting dashboard it’s a standard breakdown, and it’s usually the first one teams look at, because it answers whether a lower completion count reflects harder tasks or stalled ones.
What’s a good cycle time for Asana tasks? It depends entirely on the task type and your team’s context. A bug fix might average 1-2 days; a feature might average 5-8 days; a strategic document might average 3 weeks. The useful comparison is your team’s own historical baseline, not an external benchmark.
Related reading: how to see task completion by assignee in Asana covers the volume side of the same picture, and tracking approval cycle time applies the same measurement to review steps specifically.