
Short answer: Asana holds bugs perfectly well as tasks with a custom field, and its charts will count them. What it won’t show you is flow: how many opened against how many closed in the same period, whether the backlog is trending up or down, and how old the open ones are. Those need a reporting layer on top.
Counting bugs is not the same as understanding them
Most teams tracking bugs in Asana can answer one question instantly: how many are open right now. It’s a number on a filtered view, and it’s almost useless on its own.
A backlog of 108 open bugs means nothing without three other things. Is it growing or shrinking? How long has the average one been sitting there? And is it spread across everything you ship, or concentrated in one product that needs attention?
Those are flow questions, and a point-in-time count can’t answer any of them. Two teams with 108 open bugs can be in completely opposite situations: one closing more than it opens every week and steadily digging out, the other quietly accumulating. The count is identical. The trajectory is the opposite.
What Asana does natively
Asana handles the storage side well. A single-select custom field, a dedicated project, or a tag will all mark a task as a bug, and you can filter and group by it anywhere.
Its reporting will also count them. On qualifying plans, a chart grouped by that field gives you bug counts by status, by assignee, or by project.
Where it stops:
| What Asana can show | What it can’t |
|---|---|
| How many bugs are open now | Whether that number is rising or falling |
| Bugs grouped by assignee or project | Opened against closed in the same period |
| A filtered list of open bugs | How long the open ones have been open |
| Counts within one project | The same view split by product or client |
The recurring theme is time. Asana’s reporting describes the present accurately and keeps no history, so any question containing the word “trend” falls outside it.
The three views that make a backlog legible
This is the part we build for you, and it’s three charts rather than one.
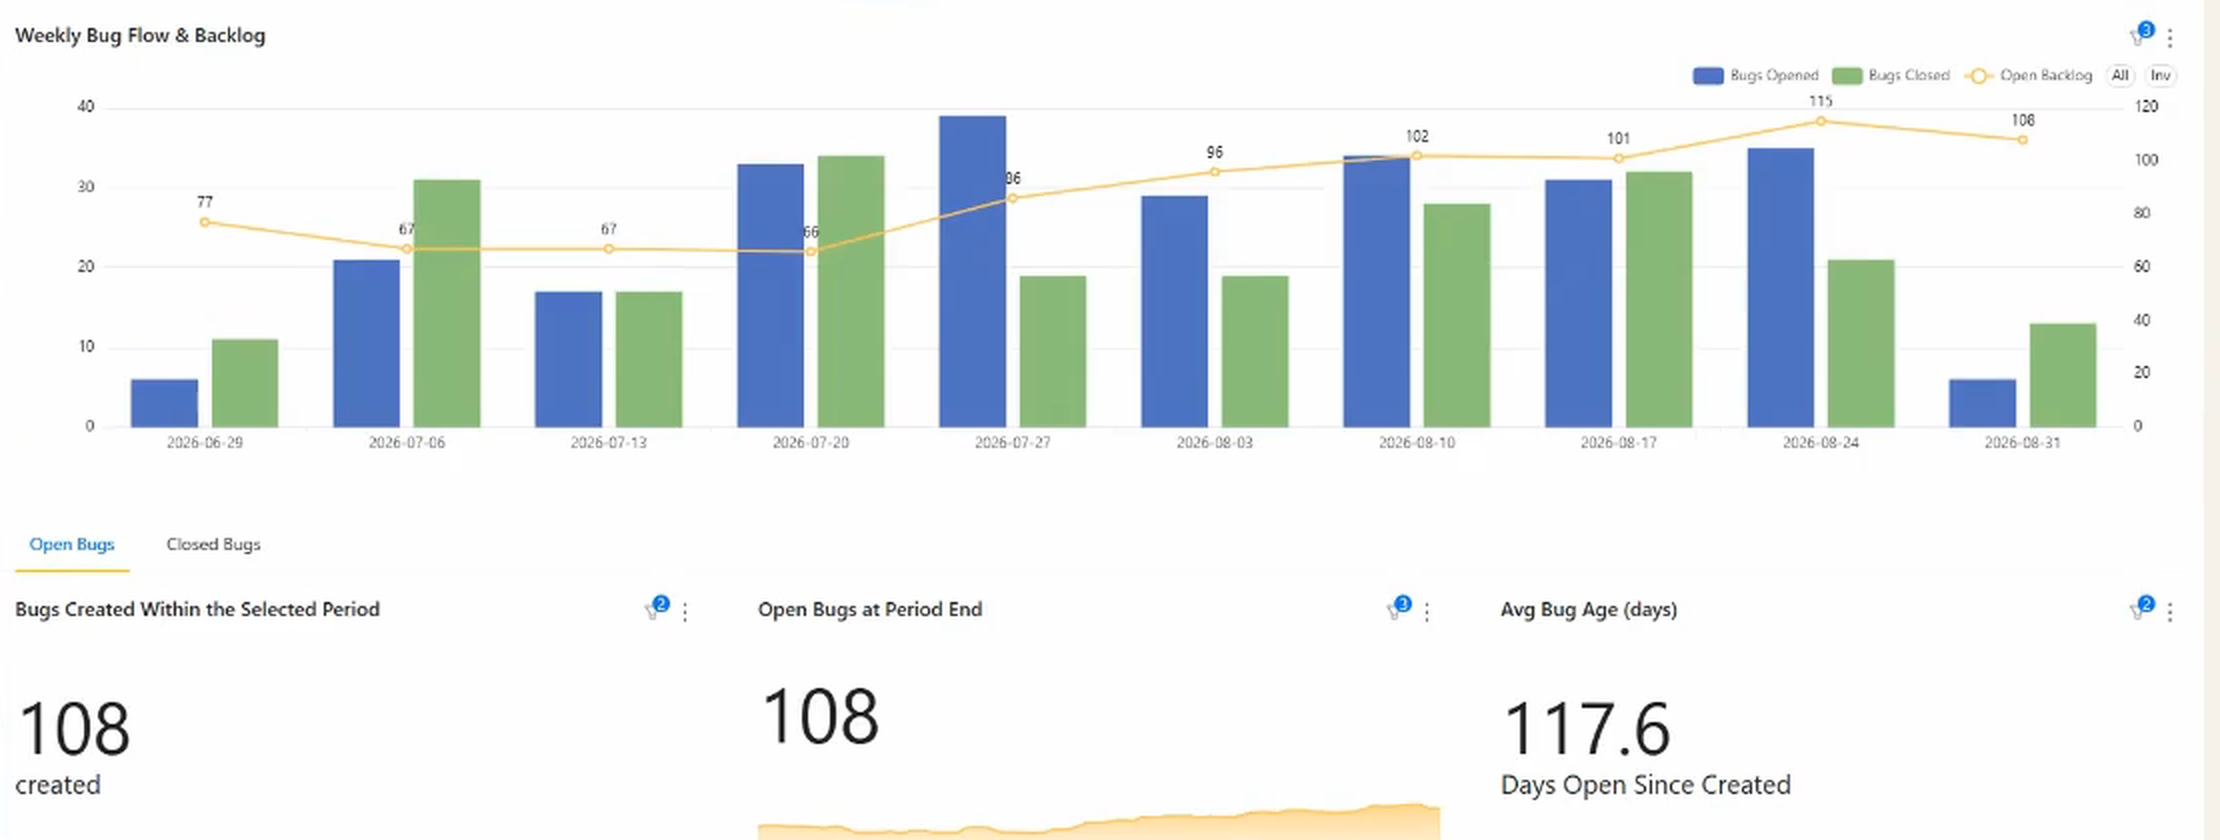
Opened against closed, week by week. The single most useful bug chart there is. Two series on the same axis, with the open backlog running across them as a line. When the closed bars are consistently taller than the opened bars, the line falls and you’re digging out. When they’re level, you’re treading water at whatever depth you’re already at.
The tiles underneath are the summary a lead actually quotes: bugs created in the period, bugs still open at the end of it, and the average age of the open ones. Read together they’re unforgiving. In the view above, 108 created and 108 still open at period end means the team closed roughly as many as arrived and ended exactly where it started, and an average age of 117.6 days says a good portion of that backlog has been there for months rather than weeks.
Backlog age. An average is a starting point; the distribution is the real story. A backlog averaging four months might be a handful of ancient items dragging an otherwise healthy queue, or it might be uniformly stale. Those need different responses, and only the spread tells them apart.
Split by a second field. Bugs by product, by client, or by component. This is where a backlog stops being a wall of tickets and starts pointing somewhere.
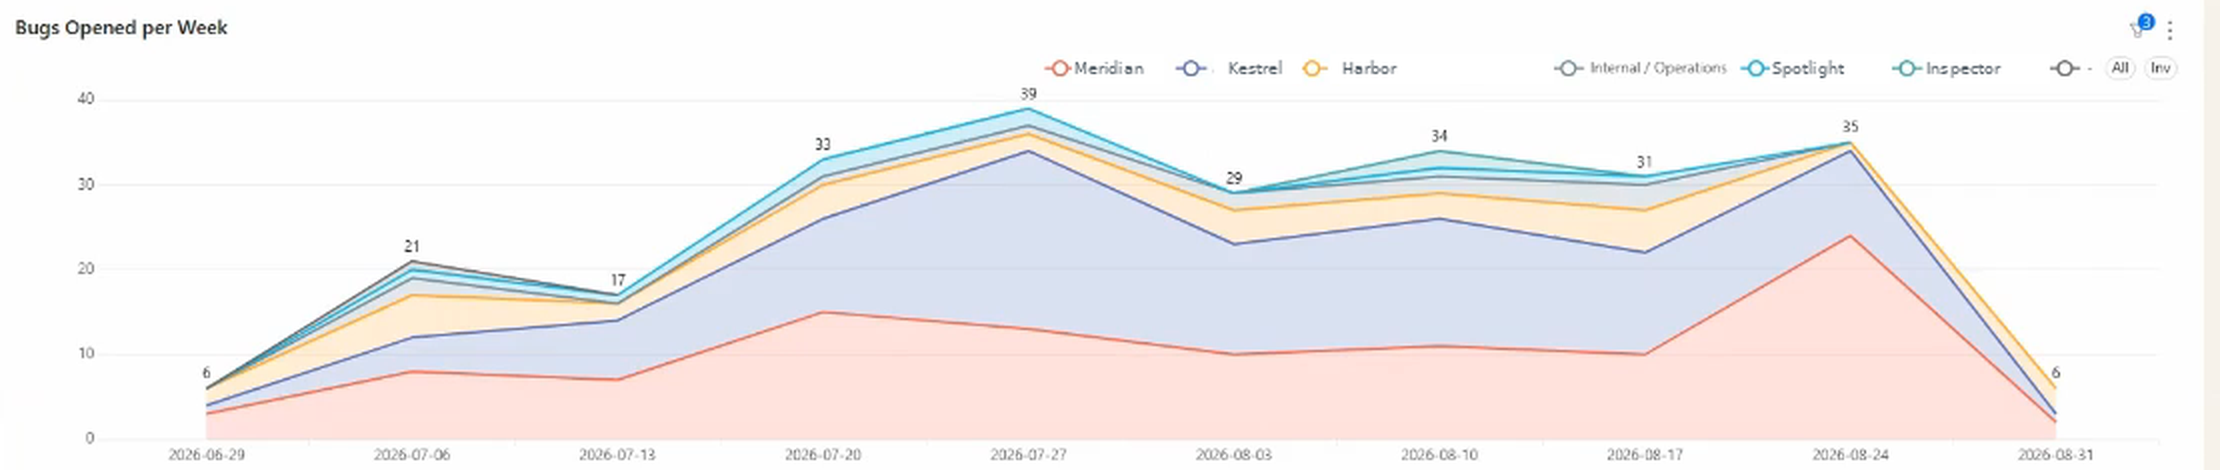
A total that triples over five weeks is alarming. The same total split by product is actionable: usually one line is driving the spike while the rest are flat, and that’s a release to look at rather than a quality problem to worry about in general.
The one column most bug reports miss
If your bugs go through review, the number of times each one has been sent back is worth carrying in the same table as its age and status. A bug that has bounced four or five times isn’t a slow bug, it’s a misunderstood one, and it usually means the reproduction steps or the acceptance criteria were never clear. That distinction is covered in more depth in why your Asana approvals keep coming back.
Want to see whether your bug backlog is actually shrinking? Book a call with Nathan and we’ll set it up against the field you use to mark bugs.
This generalises past bugs
Nothing above is specific to defects. The pattern is “reporting on tasks that carry a particular custom field value”, and bugs are simply the clearest example because every team has them and every team argues about them.
Swap the field and the same three views answer different questions. Support escalations opened against closed. Content pieces created against published. Onboarding tasks by client, with age. If you can mark it with a field, you can watch it flow.
FAQ
Can Asana track bugs? Yes, and well. A custom field, a dedicated project or a tag all work, and Asana’s reporting will count them on qualifying plans. What it won’t do is compare opened against closed over time or tell you how old the backlog is.
How do I know if my bug backlog is getting worse? Compare bugs opened against bugs closed in the same period, repeatedly. A single open count can’t tell you direction. If closed consistently exceeds opened, the backlog is shrinking regardless of how large it currently is.
What’s a reasonable average bug age? It depends far more on your product than on any benchmark, and the average is less useful than the spread. A queue averaging 30 days where nothing exceeds 60 is healthy. The same average with a tail of year-old items is not.
Should bugs live in their own Asana project? Either way works. A separate project makes filtering simpler; a custom field on your existing projects keeps bugs next to the work they relate to. What matters for reporting is that the marking is consistent, because anything unmarked drops out of every chart.
Can I see bugs by product or client? Not as a combined view natively. Asana can filter by one field at a time, but holding bugs as the subject while splitting by product needs a reporting layer. That two-field pattern is covered in segmenting by custom field.
Related reading: segmenting velocity by product in Asana, how to measure task cycle time, and why your Asana approvals keep coming back.