
Short answer: Asana doesn’t segment sprint velocity by custom field. You can see total completed story points for a project, but not velocity broken down by product, team, client, or any other custom field value. Getting a segmented velocity view requires a reporting tool that reads your Asana custom fields alongside completion data.
Why segmented velocity matters
Overall sprint velocity is one number. For teams running a single product, that number is usually enough. For teams where multiple products, clients, or work types run through the same Asana workspace, it’s often not.
Three use cases where segmented velocity becomes important:
Multi-product teams: the Mobile team and the Web team both work in the same Asana workspace. Their tasks are tagged or assigned to a “Product” custom field. Overall velocity blends their output. If Mobile consistently completes fewer points per sprint, that’s worth knowing, but it’s invisible in an aggregate number.
Agency or client work: each client project has different complexity, different team members, and different velocity patterns. Comparing velocity across clients shows which engagements are flowing and which are struggling, without waiting for a missed deadline to surface the problem.
Work type segmentation: feature development, bug fixes, and infrastructure work often take very different amounts of effort per story point. If your sprint has an unusually high mix of infrastructure work, velocity may look low even if the team is productive. Segmented velocity makes that visible.
Without segmentation, a velocity drop that’s entirely attributable to one product line looks like a team-wide slowdown.
What Asana’s custom fields enable (and where they stop)
Asana supports custom fields on tasks, including dropdown fields where you can add values like “Mobile,” “Web,” or “API” to tag tasks by product.
With custom fields in Asana, you can:
- Tag tasks with a product, client, team, or work type
- Filter the project task list by custom field value
- See column totals for numeric fields (like story points) within a filtered view
What you can’t do natively:
- Create a chart that groups velocity by custom field value
- See a grouped bar chart showing Mobile vs. Web velocity side by side for each sprint
- Track how each segment’s velocity has trended over time
- Generate a report comparing velocity across segments without manually filtering and summing each one
Asana’s chart widgets don’t have a “group by custom field” option that produces velocity-equivalent output. This isn’t a configuration issue.
Setting up custom field velocity segmentation
We read both custom field values and task completion data from Asana. You define a segment field (for example, the “Product” dropdown) and we calculate completed effort per sprint for each segment value. The effort field is whichever one you estimate in: story points, hours, complexity score.
The output is a grouped velocity chart: Mobile, Web, and API side by side for each sprint, showing completed points per sprint. The chart updates automatically after each sprint.
You can also view each segment’s velocity trend independently. If Mobile’s velocity has been declining for three consecutive sprints while Web’s has been stable, that’s a clear signal worth investigating. It’s invisible in the aggregate view.
Setup is work we do, not work you do. Once you’re a customer you tell us which field carries effort, which one you want to segment by (the dropdown representing product, team, or client), and how your sprints are defined (a section naming pattern, or a date range). We build it, then get on a call and walk you through it. After that the segmented velocity chart generates automatically and updates each sprint.
Two dimensions at once
One segment field answers “which product line is moving fastest.” Stacking a second one answers questions that are usually much closer to what you actually wanted to know.
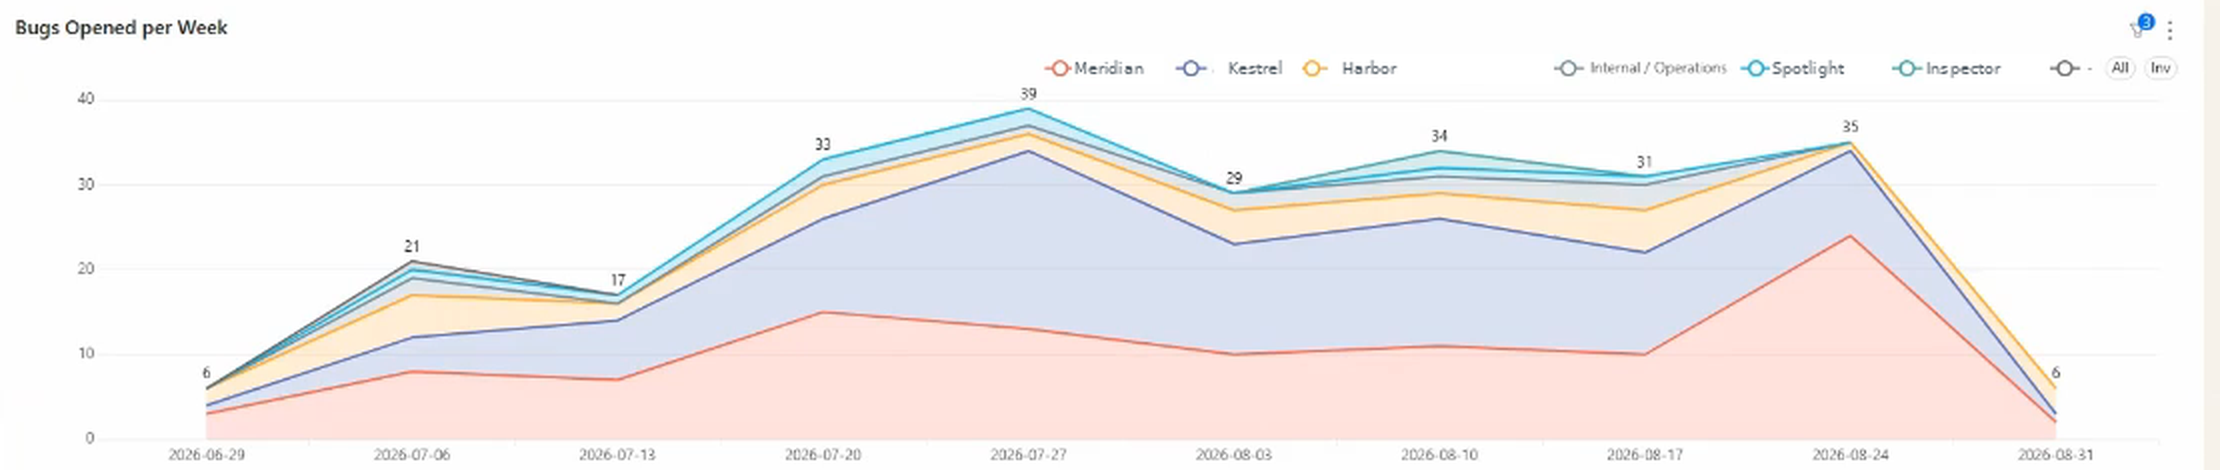
The pattern is to hold one custom field as the subject and use another as the split. Bug-type work broken out by product, week over week. Feature work by client. Infrastructure work by team. Each combination is the same underlying data cut a different way, and the second dimension is almost always where the insight is.
That’s one work type (bugs) split by a second field (product). The total tells you volume roughly tripled over five weeks and then collapsed. The split tells you which product lines drove it, and that the collapse wasn’t uniform. Neither reading is available from the total alone. “Our velocity dipped” is a shrug, while “our velocity dipped because bug work on one product tripled” is a decision.
This is worth knowing before you design your custom fields, because it changes what makes a good one. Fields with a handful of stable, meaningful values (product, work type, client, priority) stack well and stay readable. Free-text fields and fields with dozens of values don’t, because they produce charts with too many series to interpret. If you’re setting up fields now with reporting in mind, favour short controlled lists over anything free-form.
Want to see velocity broken out by product line, team, or client side by side? Book a call with Nathan. He’ll show you segmented velocity on a live dashboard and how it would split your own work.
What to do with segmented velocity data
Once you can see velocity per segment, the data becomes useful for planning and diagnosis.
Identifying underperforming segments: if one product line consistently completes fewer points per sprint, investigate whether the tasks in that segment are larger on average, whether the team working on that product has less capacity, or whether there are more external dependencies slowing progress.
Normalizing for complexity: two segments can have the same velocity but very different complexity per story point. If Mobile tasks are consistently larger and harder than Web tasks, Mobile’s lower point count may reflect accurate estimation rather than lower performance.
Capacity planning: when adding headcount to a specific product team, the segmented velocity baseline tells you what the current output is per person. Adding one engineer to Mobile (current velocity: 28 points per sprint with 3 engineers) gives you a data-informed estimate of expected impact.
Pairing with cycle time: some segments may have lower velocity because tasks take longer on average, not because fewer tasks are done. Comparing cycle time by custom field alongside velocity by custom field gives a fuller picture of where time is going. See also: how to measure task cycle time in Asana.
FAQ
Can Asana segment sprint velocity by product or team? Not natively. Asana lets you create custom fields and filter by them, but there’s no chart widget that groups velocity by custom field value and shows the result per sprint.
How do I compare velocity across different Asana projects? Asana doesn’t have a cross-project velocity view. A reporting tool that reads multiple projects and aggregates by custom field can compare output across them, which is the typical approach for multi-product or multi-client setups.
What custom fields should I use to segment velocity? The most useful segmentation fields are ones that represent a meaningful work distinction: product line, client, team, or work type (feature vs. bug fix vs. infrastructure). Avoid high-cardinality fields (like individual assignee) for velocity segmentation, as too many segments make the chart hard to read.
How is segmented velocity different from overall velocity? Overall velocity is total completed story points per sprint, across all work. Segmented velocity is the same calculation applied separately to each subset of work defined by a custom field value. Segmented velocity is more useful when different work types or teams have meaningfully different output patterns.
Related reading: how to track sprint velocity in Asana, tracking historical sprint velocity, and how to measure task cycle time.