
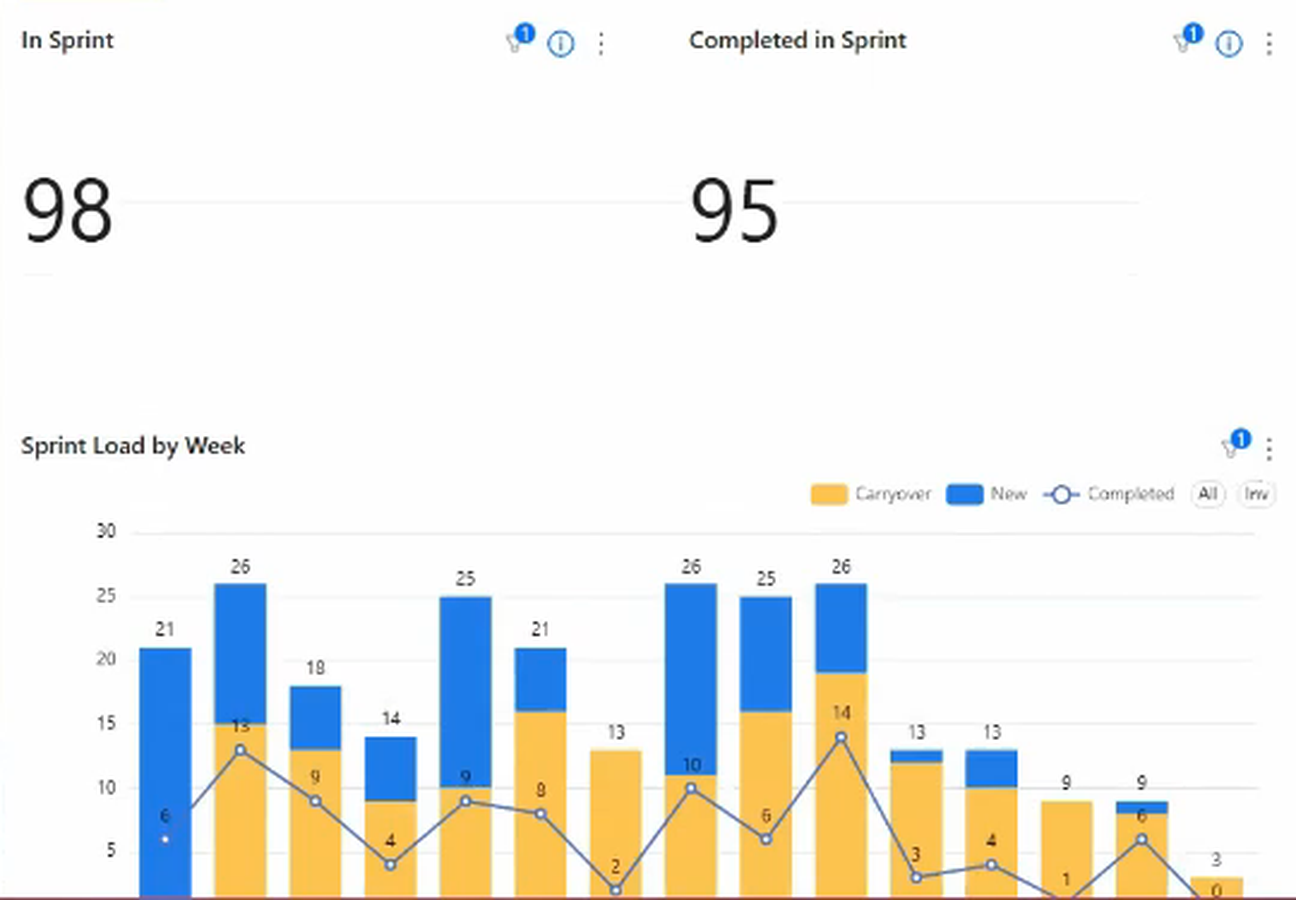
Short answer: Asana doesn’t store historical sprint velocity. There’s no native chart that shows story points completed per sprint over time. Tracking velocity trends requires either maintaining a manual log after each sprint or using a reporting dashboard that rebuilds the history from the completion dates already on your tasks.
Why historical velocity matters more than current velocity
A single sprint’s velocity is a data point. The trend across multiple sprints is the signal.
Teams that track only current velocity know what they completed in the last sprint. Teams that track historical velocity can answer:
- “How much should we commit to next sprint?” A rolling average from the last 3-5 sprints gives a realistic capacity baseline that adjusts as the team’s context changes.
- “Are we improving?” Velocity trending upward over 6+ sprints usually signals maturing processes and better sprint discipline. Velocity declining for 3+ sprints usually signals something worth investigating.
- “Did that process change work?” After introducing sprint retrospectives, a new estimation approach, or a dedicated sprint planning session, historical velocity shows whether it moved the number.
A team using only their most recent sprint for planning is essentially using n=1. Historical velocity reduces planning variance and makes the “why did we miss?” conversation easier.
Why Asana can’t show historical velocity natively
The gap is structural, not a missing feature.
Historical velocity requires two things:
- A way to group tasks by sprint, with a defined start and end date per sprint
- A snapshot of completed story points at the end of each sprint, stored so you can retrieve it later
Asana’s sprint model uses sections or tags to represent sprints (a section named “Sprint 15,” for example). These are visual groupings, not sprint objects. They don’t have defined start/end dates, and Asana doesn’t record “points completed in this sprint” as a data point when work ends.
Jira handles this with native sprints: when a sprint closes, Jira records the completed points and generates a sprint report. Asana has no equivalent. If you complete 44 story points in a sprint and then start Sprint 16, Asana has no record that Sprint 15 ended with 44 completed points.
This is also why Asana’s own educational content about sprint velocity stops short of showing a velocity chart. The concept is documented; the product can’t generate the chart from the story points field it supports.
Building a manual velocity log
For teams willing to maintain it, a manual log works:
- At the end of each sprint, filter Asana for completed tasks in the sprint section
- Sum the story points column (or export to CSV and sum in a spreadsheet)
- Add a row to a running log: sprint number, end date, completed points, team size
- In Google Sheets, build a line chart from the log
The log becomes your velocity history. A 3-sprint rolling average from this log is your planning baseline.
This approach has a real maintenance cost. Someone has to do this every sprint without fail. Miss one sprint and the trend line breaks. The manual entry also means no mid-sprint visibility and no automatic breakdown by product or assignee.
For a 4-person team running 2-week sprints, the total effort is about 10 minutes per sprint. For larger teams or teams running multiple concurrent sprint tracks, it gets harder to maintain consistently.
Getting historical velocity from Asana automatically
Here’s the part that surprises most teams: you don’t have to start collecting data and wait.
Every completed task in Asana already carries the date it was created and the date it was finished. That’s enough to reconstruct what each past sprint completed, retroactively, from work that’s already sitting in your workspace. So the velocity history exists on day one rather than beginning to accumulate on day one. You can look back over the last six months of sprints in the first session, not six months from now.
Two honest caveats. The reconstruction covers tasks that still exist; anything deleted from Asana before we connected is genuinely gone and can’t be recovered. And the further back you go, the more likely your sprint conventions changed: a section naming pattern that shifted, a period where the effort field wasn’t filled in consistently. That shows up as gaps or odd-looking sprints in the early history. Neither is a reason to distrust the trend; both are reasons to read the oldest sprints with a little more care than the recent ones.
The historical velocity dashboard shows:
- Effort completed per sprint (story points, hours, or whichever field you estimate in), plotted across every sprint in the history
- A trend line that makes improving or declining velocity visually obvious
- Breakdown by custom field: if you use a “Product” or “Team” field, you can see velocity per product line side by side (covered in segmenting sprint velocity by product in Asana)
- Rolling average line, automatically calculated, useful for sprint planning
This view is particularly useful for quarterly velocity reviews with leadership. “We improved from an average of 32 points per sprint in Q1 to 48 points in Q3” is a defensible statement when it comes from 15 sprints of data, not from comparing last sprint to the sprint before it.
Want your sprint velocity history charted automatically, with the trend line and rolling average already worked out? Book a demo with Nathan. He’ll show you a velocity history running on a live dashboard and how far back yours could reasonably go.
Interpreting velocity trends
Once you have multi-sprint data, here’s how to read common patterns:
Steady upward trend over 6+ sprints: the team is maturing. Improved estimation, better sprint discipline, or a team that has stopped pulling in mid-sprint work can all produce this.
Flat line over many sprints: the team has reached a stable output level. This isn’t inherently a problem, but if the goal is to increase throughput, a flat velocity signals that process changes or investment may be needed.
Downward trend for 3+ consecutive sprints: something has changed. Common causes: team composition change, increased scope complexity, accumulating technical debt, or a gradual burnout pattern. The velocity chart surfaces the trend; the sprint retrospectives surface the cause.
High sprint-to-sprint variance: sprints are wildly different in output. Often caused by mid-sprint scope adds, inconsistent backlog preparation, or unreliable estimation. The fix is usually sprint hygiene, not team capacity.
Sprint load history reads alongside velocity and often explains it. Splitting each week into carried-over and newly added work shows something a completion percentage hides: 97% completion looks excellent until you notice 62 of the 98 items were already there last week. The carryover share is the leading indicator — it starts climbing several sprints before velocity visibly drops.
Normalizing for team size: if your team grows or someone leaves, raw velocity changes. Points per person per sprint controls for that variable and gives a more accurate picture of productivity change.
FAQ
Does Asana have a velocity report? Not natively. Asana supports story points as a custom field and lets you complete tasks, but it doesn’t generate a per-sprint velocity report or store velocity history.
How do I see sprint history in Asana? Asana keeps all tasks, sections, and completed work in your project history. You can filter by section to see what was in each sprint. What you can’t do is get a summary of completed story points per sprint without manually summing them.
How many sprints do I need for a meaningful trend? Six sprints is a reasonable minimum. With fewer than six data points, it’s easy to mistake normal variance for a trend. Twelve sprints (roughly one quarter of 2-week sprints) gives a more reliable signal.
How is historical velocity different from current velocity? Current velocity is the completed story points from the most recent sprint. Historical velocity is the series of completed points across many sprints, which enables trend analysis, rolling averages, and planning accuracy that a single sprint’s data can’t support.
Related reading: how to track sprint velocity in Asana, segmenting sprint velocity by product, and how to measure task cycle time.