
Short answer: Asana doesn’t calculate sprint velocity from custom fields. You can add a story points field, assign values to tasks, and mark work complete, but there’s no built-in report that sums completed points per sprint and plots them over time. For that, you need either a manual spreadsheet updated after each sprint or an external reporting tool that reads your Asana data and calculates velocity automatically.
What sprint velocity is and why dev teams track it
Sprint velocity is the amount of effort your team completes in a sprint, measured in story points or whatever other unit you estimate in. Calculated sprint over sprint, it gives you two things:
- A planning baseline: if your last five sprints averaged 42 points, committing to 60 in the next sprint is a risk worth flagging
- A trend signal: velocity that’s been increasing suggests the team is finding its rhythm; velocity that’s been declining often signals burnout, blocked work, or scope problems
Velocity and burndown answer different questions: velocity measures what was completed, accumulated across sprints, for planning future capacity. For the full side-by-side with burndown and how to build one from Asana data, see our Asana burndown chart guide.
A team that tracks velocity can answer “how much should we commit to next sprint?” with data. A team that doesn’t is either guessing or padding the sprint and calling it conservative.
What Asana can do with custom fields (and where it stops)
Asana supports numeric custom fields. You can create a “Story Points” field, add it to your project, and assign values to each task. The project list view will show a column total at the bottom.
Here’s where native support ends:
| What Asana supports | What Asana doesn’t support |
|---|---|
| Creating a numeric story points field | Summing completed points per sprint |
| Assigning point values to tasks | Charting velocity over multiple sprints |
| Viewing column totals in list view | Filtering velocity by team member or product |
| Filtering and sorting by story points | Storing a velocity history you can review later |
The sprint model in Asana also creates a problem. Most teams use sections or tags to represent sprints (e.g., a section named “Sprint 14”). Asana has no native sprint object with a defined start date, end date, and completed-points summary. Without that structure, there’s no way for a chart widget to produce “points completed in Sprint 14.”
Why there’s no native velocity chart
This isn’t a missing feature that will appear in settings. It’s an architectural gap.
Velocity requires grouping tasks by sprint and summing a custom field value for completed tasks within that group. Asana’s chart widgets can count tasks and filter by custom field value, but they can’t aggregate a numeric field across a sprint boundary.
Jira solves this with a native sprint object: when a sprint ends, Jira records the completed points as a data point in the sprint report. Asana doesn’t have an equivalent. A section named “Sprint 14” is just a visual grouping, not a queryable sprint record.
This is also why looking at Asana’s educational content on velocity can be frustrating. Asana publishes articles about why sprint velocity matters for agile teams, but the product itself can’t generate a velocity chart from the story points field it lets you create.
How to track sprint velocity from Asana data
There are two approaches, and the right one depends on your team’s size and how much you want to rely on manual process.
Option 1: Manual spreadsheet after each sprint
After every sprint ends:
- Filter Asana to show completed tasks in the sprint section
- Sum the story points column (or export to CSV and sum in a spreadsheet)
- Log the number to a rolling velocity log: Sprint #, end date, completed points, team size
Over time, this log becomes your velocity history. Build a line chart in Google Sheets.
The catch: this requires someone to do it every single sprint. Miss one, and the trend line breaks. It also doesn’t capture any mid-sprint data, so there’s no way to see what happened within a sprint, only after it.
Option 2: A reporting tool that reads your Asana data automatically
We read your effort field from your Asana workspace and calculate completed effort per sprint automatically. Story points are the common case, but the field is yours to choose: hours estimated, complexity score, t-shirt sizes converted to numbers. Anything numeric that represents how much work a task is works the same way. You define what a “sprint” looks like in your Asana setup (the section name pattern, the tag you use, the date range) and BlinkMetrics handles the aggregation from there.
The output is a velocity chart showing points completed per sprint across your history, with a trend line and the option to break it down by custom field (by product, team, or work type).
Setup is ours to do rather than yours. You tell us which field carries effort and how your sprints are defined; we build it and then walk you through the result. After that the chart updates on its own as each sprint closes.
Want to see your velocity trend across the last 6+ sprints, with a rolling average you can plan against? Schedule a strategy call with Nathan. He’ll show you a velocity trend running on a live dashboard and how it would work against your sprints.
Velocity is one number on a sprint dashboard, not the whole thing
Velocity alone will tell you how much got done. It won’t tell you whether the sprint worked. Those are different questions, and the second one is usually the one being asked in the retro.
A sprint view worth having puts velocity next to four other things:
Completion rate. Tasks committed, tasks completed, and the percentage between them. The raw counts matter as much as the ratio, because 8 of 10 and 40 of 50 are the same percentage and very different sprints.
Carryover. How many tasks came out of the sprint unfinished and rolled into the next one. This is the number that catches slow decay: a team can hit a respectable completion rate every week while the same handful of items rolls forward indefinitely, and only a carryover count makes that visible.
Sprint load, split by new versus carried over. Week by week, how much of the sprint is fresh work and how much is last week’s leftovers. A rising carryover share is an early warning that commitments are outrunning capacity, and it shows up here weeks before it shows up in velocity.
Per-person open versus completed. Where the sprint actually stands by team member, so a sprint that’s 80% done overall but entirely stalled on one person’s queue reads correctly.
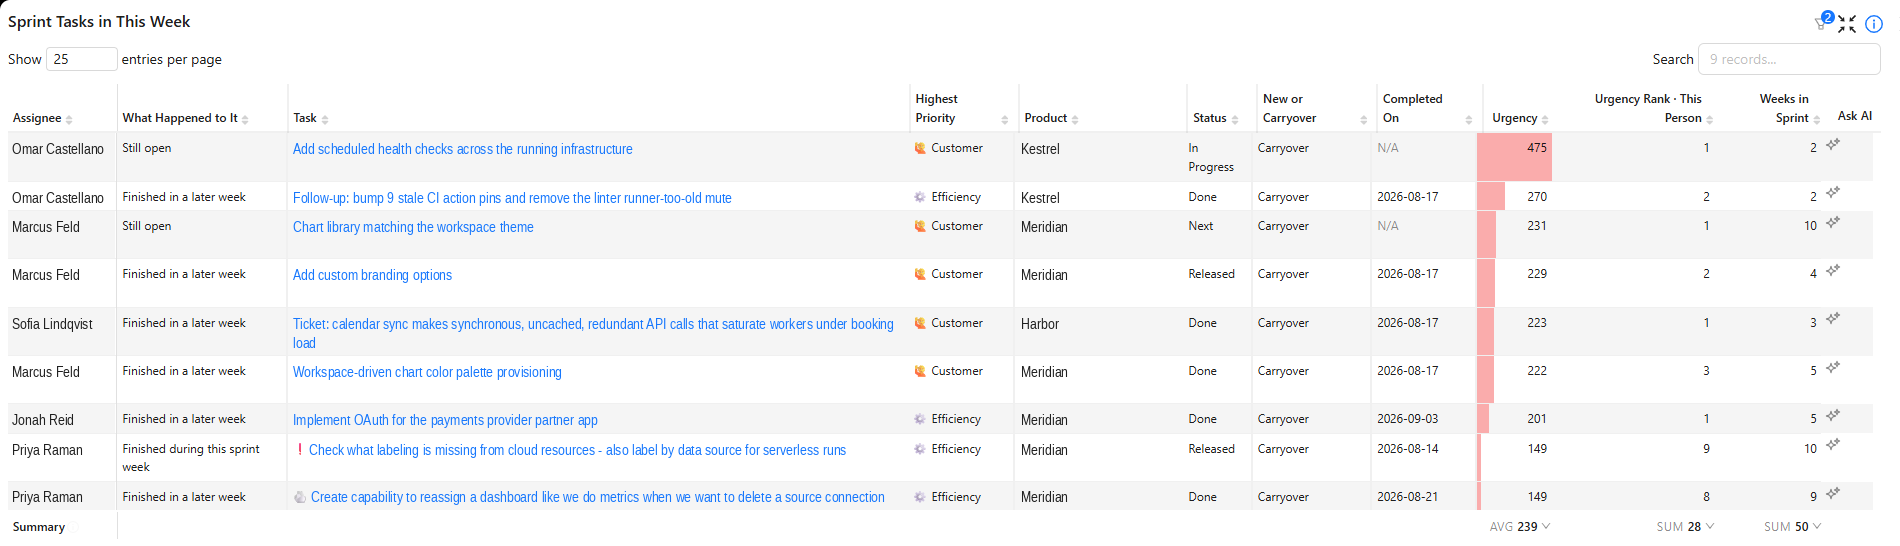
Underneath those, the sprint task list itself: each task flagged new or carryover, with its status, assignee, and priority. For teams that score work by urgency, the useful addition is each task’s rank within that person’s own queue. Knowing an item is third in line for the person who owns it tells you roughly when it’ll be picked up, which is a far better forecast than a due date nobody set deliberately.
The last two columns are the ones to read together. All nine of these are carryover, and one row explains the pattern: an item that has been in the sprint for 10 weeks ranks only ninth in its owner’s queue — which is the honest explanation for why it keeps rolling. It isn’t forgotten, it just never becomes the most important thing that person could be doing. A sprint board without those columns shows the same task moving forward each week with no reason attached.
And the question that usually explains a missed sprint: what did the team do instead? Unplanned work is the most common reason a sprint slips, and it stays invisible unless you measure it on purpose, by counting what got done that was never committed to and comparing how urgent it was against what it displaced. A sprint report that shows only what was planned will never explain the gap.
Using velocity data for sprint planning and trend analysis
Once you have a velocity history, the data becomes useful in two ways.
Sprint planning: Use your rolling average as your capacity estimate. Most teams use a 3-sprint rolling average to smooth out outliers (a sprint where half the team was at a conference, for instance). If your last three sprints averaged 40 points, that’s your planning baseline. Adding 20% for stretch is reasonable. Adding 50% is optimism.
Trend analysis: Velocity that’s stable signals a predictable team. Velocity trending up signals improvement. Velocity trending down warrants investigation before the next sprint planning session, not after.
Watch for these patterns:
- Sudden drop: check for team composition changes, unplanned work, or a particularly complex sprint
- Gradually declining over 3+ sprints: this is the burnout or backlog quality signal
- High variance sprint over sprint: scope is being added mid-sprint, or estimates are inconsistent
If you want to compare velocity across product lines or teams, that requires breaking down the velocity chart by a custom field. That’s covered in segmenting sprint velocity by product in Asana.
FAQ
Does Asana track sprint velocity? Not natively from custom fields. Asana allows you to create a story points field and complete tasks, but it doesn’t aggregate completed points per sprint or show a velocity chart.
How do I set up story points in Asana? In your project, go to the custom fields menu and create a numeric field named “Story Points.” Assign values to tasks by entering a number in that field. The column footer will show the total. That’s where native support ends.
What’s the difference between velocity and burndown? Velocity measures story points completed per sprint, accumulated over time. It’s a planning and trend metric. Burndown shows remaining effort within the current sprint in real time. Both use story points but serve different decisions.
Can Asana show velocity over time? Only with an external reporting tool. Asana stores current task state but doesn’t build a per-sprint velocity history from custom fields. A tool like BlinkMetrics reads your Asana data and constructs the velocity trend from task completion timestamps and point values.
Related reading: Asana burndown chart: tracking remaining effort, tracking historical sprint velocity, and segmenting sprint velocity by product.