
Short answer: Asana lets you filter, sort and group by a custom field, and on higher tiers chart counts grouped by one. What it won’t do is combine two fields in a single view, sum a numeric field over time, or calculate a new value from the ones you have. Those are the three limits nearly every reporting request runs into.
Custom fields are where your business actually lives
Every Asana workspace looks roughly the same out of the box: tasks, assignees, due dates, sections. The part that makes it yours is the custom fields. Product. Client. Work type. Effort. Priority. Stage.
That’s also why reporting gets frustrating faster than people expect. The questions worth asking are almost never about tasks in general, they’re about tasks carrying a particular value. How much did we ship for this client. Which product generates the most defects. Are we spending more time on reactive work than we were last quarter.
Every one of those is a custom field question, and how far Asana gets with them depends entirely on which of three shapes the question takes.
What Asana does natively
Genuinely useful things, worth knowing before assuming you need anything else:
- Filter any view by one or more field values
- Sort and group a list or board by a field
- Column totals for numeric fields in list view
- Rules that set a field automatically when a task meets a condition
- Charts grouped by a field, on qualifying plans: task counts split by product, client or work type
For a lot of teams that’s enough, and the honest advice is to exhaust it before looking further.
Where it stops
Three limits, in the order teams hit them:
One field at a time. You can chart tasks by product. You can chart tasks by work type. You can’t chart bug-type tasks split by product in a single view, which is usually the question that prompted the chart.
No arithmetic on numeric fields. Asana will total a column in a list view. It won’t sum that field across a period, trend the sum over time, or average it. If you’ve gone looking for how to sum custom fields in Asana across a date range, this is the wall you hit: a story points field can be added up by eye in a list today, but it can’t become a velocity chart.
No calculated values. A field holds what someone typed. Asana can’t derive one field from others, so anything of the form “score this by combining due date, dependencies and category” is outside what the field system does. That gap is what the priority pyramid and urgency score exist to fill.
The three shapes reporting takes
Once a dashboard sits on top of your Asana data, custom fields stop being labels and start being dimensions. Three patterns cover nearly everything teams ask for.
Filter by several at once
The most basic and most used. Every view responds to the same set of filters, so one page answers many questions instead of needing a chart per question.

Sprint week, assignee, product, priority, work item type, all applying at once and all driving every chart below them. Narrow to one product and the completion counts, the cycle times and the per-person breakdowns all move together. This is the difference between a dashboard and a folder of charts.
Hold one field, split by another
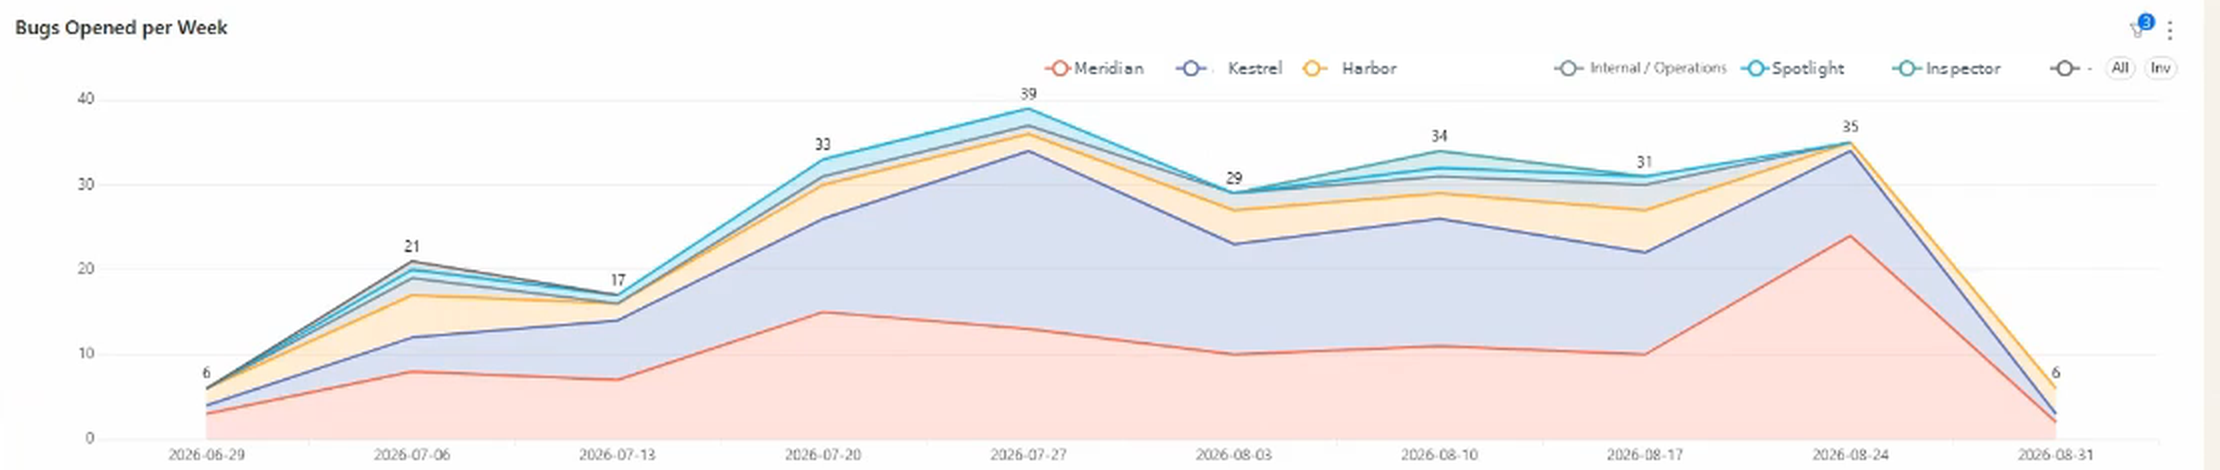
The pattern that answers the questions Asana can’t. One field defines the subject, a second splits it, and time runs along the axis.
Bug-type work, split by product, week over week. The total says volume tripled and then collapsed; the split says which line drove it. “Our defect count spiked” is a shrug. “Our defect count spiked because of one product’s release” is a decision. Same data, one extra dimension.
Use a field as a measure, not a label
The third shape treats a numeric field as the thing being counted rather than a category to group by. Sum an effort field per sprint and you have velocity. Feed a priority field into a score and you have a ranking. Read a numeric field alongside completion dates and you have cycle time by category.
This is the shape Asana is furthest from, because it requires arithmetic the field system doesn’t do.
Designing fields you can actually report on
Most reporting problems are field-design problems that surfaced late. A few rules worth applying before you have a hundred tasks carrying a field you regret.
Short controlled lists beat free text. A single-select with six values charts beautifully. A text field with sixty variants of the same six values charts as noise, and cleaning it later is worse than defining it now.
Fewer values than you think. Every value you add is a series on a chart. Past about eight, legends stop being readable and the distinctions stop being applied consistently, which is worse than not having them.
One field, one question. A field called “Status” that mixes workflow stage with work type will eventually need splitting, and splitting it retroactively across live tasks is unpleasant.
Make required what reporting depends on. Anything blank drops out of every chart silently. If a field drives your reporting, a task without it isn’t neutral, it’s invisible.
Numeric where you’ll want maths. A t-shirt size field can’t be summed. The same estimate as a number can. If there’s any chance you’ll want to total it, store it as a number and label it in the view.
Want to see your own fields working as dimensions rather than labels? Book a call with Nathan and we’ll set it up against the fields you already use.
FAQ
Can Asana chart by custom field? Yes, on qualifying plans. A chart grouped by a single-select field gives you task counts per value. What it can’t do is combine two fields in one view or sum a numeric field over time.
Can I report on two custom fields at once? Not natively. Asana filters by multiple fields, but its charts group by one. Holding one field as the subject while splitting by a second needs a reporting layer.
Can I sum a custom field in Asana? Only within a single list view, as a column total. Asana won’t sum a numeric field across a date range, trend that sum over time, or average it, which is what turns an effort field into a velocity chart. That calculation needs a reporting layer.
Can Asana calculate a field from other fields? No. Custom fields store values that were entered or set by a rule. Deriving one from others, such as scoring a task from its due date and category, is outside what the field system does.
Which custom fields are worth creating for reporting? The ones representing distinctions your business genuinely argues over: product, client, work type, effort, priority. Keep them as short single-selects rather than free text, and make the ones your reporting depends on required.
What happens to tasks with a blank custom field? They drop out of any view grouped or filtered by it. That’s the most common cause of numbers that look wrong, and it’s worth running a periodic list of tasks missing the fields your reporting relies on.
Related reading: segmenting velocity by product, Asana bug tracking, measuring task cycle time, and the priority pyramid.